
Surveys · Nonresponse, weighting and data quality
Nonresponse Bias: When Low Response Rates Matter and When They Do Not
Response rates have fallen sharply, yet many low-response surveys remain accurate. This article explains what actually drives nonresponse bias, what the research evidence shows, and how to assess and reduce it.
Survey response rates have fallen dramatically over the past few decades. Telephone surveys that once reached a majority of sampled households now commonly obtain responses from fewer than one in ten. Pew Research Center reported that the typical response rate of its telephone surveys fell to 6% in 2018, after holding at around 9% for several years (Kennedy & Hartig, 2019). Face-to-face household surveys, long regarded as the most reliable, have also seen rising nonresponse despite growing effort to reach people (Williams & Brick, 2018). Brick and Williams (2013) documented the same rise across major cross-sectional surveys.
It would be natural to conclude that surveys with low response rates must be unreliable. The research evidence tells a more interesting story. A low response rate creates the risk of bias, but it does not guarantee it, and a high response rate does not guarantee accuracy. Whether nonresponse distorts a survey's results depends on why people do not respond and how that relates to the questions being asked. This article explains the theory, reviews the key evidence, and sets out practical ways to judge and reduce nonresponse bias.
Key terms
Nonresponse occurs when a person selected for a survey does not take part (unit nonresponse) or skips particular questions (item nonresponse). This article concentrates on unit nonresponse.
The response rate is the share of eligible sampled people who complete the survey. Calculating it correctly is less simple than it sounds, because some sampled cases are of unknown eligibility. The American Association for Public Opinion Research publishes standard definitions for several response rates and related outcome rates so that surveys can be compared consistently (American Association for Public Opinion Research [AAPOR], 2023).
Nonresponse bias is the difference between the estimate a survey produces from its respondents and the value that would have been obtained had everyone selected responded. It is a property of a particular estimate, not of the survey as a whole. One survey can produce estimates with large nonresponse bias for some questions and almost none for others.
The arithmetic of nonresponse bias
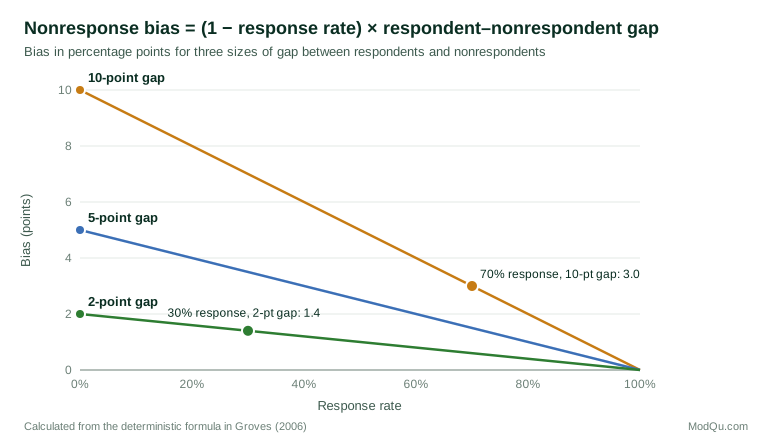
The simplest way to see how nonresponse bias arises is to divide the sample into respondents and nonrespondents. For the mean of some variable y, the bias of the respondent mean is:
Bias(ȳr) = (1 − RR) × (ȳr − ȳm)
where RR is the response rate, ȳr is the mean among respondents and ȳm the mean among nonrespondents (Groves, 2006). The formula shows that bias depends on two things: the share of the sample that did not respond, and how different the nonrespondents are from the respondents on the variable being measured.
If respondents and nonrespondents hold the same views, there is no bias, however low the response rate. If they differ greatly, there can be substantial bias even at a high response rate. A survey with a 30% response rate and a two-point difference between respondents and nonrespondents has a bias of 1.4 points; one with a 70% response rate and a ten-point difference has a bias of 3 points.
A more realistic view treats each person as having a response propensity, a probability of responding that depends on their circumstances and on how the survey is conducted. In this view, the bias of the respondent mean is approximately the covariance between response propensity and the survey variable, divided by the average response propensity (Groves, 2006). Put simply, bias arises when the people more likely to respond are also systematically different on the thing being measured. If the factors that make people respond are unrelated to the survey's topic, bias will be small whatever the response rate.
Why people do not respond
The causes of nonresponse therefore matter more than its level. Groves (2006) described three broad situations.
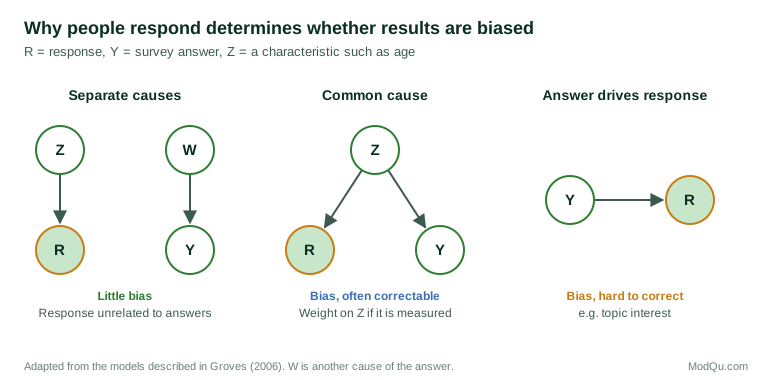
Separate causes. People fail to respond for reasons unconnected with the topic, such as being busy, travelling or not answering calls from unknown numbers, and those reasons are unrelated to their answers. Nonresponse then reduces the sample size but introduces little bias. Failing to contact someone and failing to gain their cooperation are distinct processes with different causes (Groves & Couper, 1998).
Common causes. Some factor influences both whether people respond and how they would answer. Age is a common example: older people are often more willing to respond, and they also differ from younger people on many attitudes. Bias results, but if the common cause is measured and known for the population, weighting can largely correct it.
The survey variable itself causes response. Sometimes the very thing being measured affects participation. People with strong interest in a topic are more likely to take part in a survey about it, so a survey about volunteering may over-represent volunteers (Abraham et al., 2009), and a survey about a product may over-represent its enthusiasts and its fiercest critics. This is the most dangerous case, because the bias is directly tied to the estimate and is difficult to remove by weighting on other characteristics.
Leverage-saliency theory helps explain these patterns. Groves et al. (2000) proposed that a person's decision to respond depends on how they weigh different features of the survey request, such as its topic, sponsor, length and any incentive, and on how prominent those features are made at the moment of the request. Someone with a strong interest in the topic is drawn in when the topic is emphasised; someone with no interest may respond only because of an incentive. When topic interest drives participation and is related to the answers, bias follows. Experiments support this account: sampled people were more likely to take part in surveys on topics that interested them (Groves et al., 2004), and deliberately varying how a topic was presented in the invitation produced measurable nonresponse bias on related estimates (Groves et al., 2006).
What the evidence shows
Experiments that varied the response rate
The most direct evidence comes from studies that deliberately ran the same survey at different levels of effort. Keeter et al. (2000) compared a standard five-day telephone survey with a much more rigorous version conducted over several weeks with repeated callbacks and refusal conversion. The rigorous version achieved a far higher response rate, yet across a wide range of political and social measures the two surveys produced very similar results. Keeter et al. (2006) repeated the experiment some years later, again obtaining a much higher response rate with extra effort, and again found that most estimates differed little.
Curtin et al. (2000) examined the University of Michigan's long-running Index of Consumer Sentiment. They found that excluding the respondents who required the most effort to interview, which would have substantially lowered the response rate, had little effect on the index. In each of these studies, the extra respondents gained by greater effort were not very different from those who responded readily.
Meta-analysis of nonresponse bias
Groves and Peytcheva (2008) assembled 59 methodological studies in which the true values of some variables were known for both respondents and nonrespondents, usually from sampling frame or administrative records. This allowed them to measure nonresponse bias directly across hundreds of estimates. Their central finding was that the response rate was a poor predictor of nonresponse bias. Bias varied much more between different estimates within the same survey than between surveys with different response rates. Some surveys with high response rates had large biases on particular estimates, while some with low response rates had very little.
This finding has an important consequence: the response rate alone is not a good measure of a survey's quality. It is a measure of risk, and of the room within which bias can occur, but the actual bias depends on the estimate. Peytchev (2013) reviewed the wider consequences of nonresponse and noted that it also affects the variance and cost of surveys, not only their bias.
Where nonresponse bias is consistently found
Methodological studies also point to the kinds of estimates where nonresponse bias tends to be real and persistent. Estimates related to civic and social engagement, such as volunteering, attending community meetings or contacting public officials, are often overstated, because people who take part in civic life are also more likely to take part in surveys (Abraham et al., 2009). Estimates related to the survey's topic are vulnerable when topic interest drives participation. Groups that are harder to contact or less willing to respond, often including younger people, people living alone, and people with lower incomes or less formal education, tend to be under-represented, and any estimate related to those characteristics can be biased if the imbalance is not corrected.
When low response rates matter
Drawing these strands together, low response rates are most likely to matter when:
- The topic drives participation. If people choose whether to respond based on their interest in or views about the subject, estimates on that subject are at risk.
- Respondents differ from nonrespondents on key characteristics that are related to the answers, and those characteristics cannot be measured or corrected.
- The estimate concerns behaviour that is linked to cooperativeness, such as volunteering, civic participation or willingness to help.
- The goal is a precise estimate of a level, such as the exact share of a population holding a view, rather than a comparison or trend.
- Nonresponse changes over time, so that trends reflect changing composition rather than real change.
When they matter less
Low response rates are less likely to produce serious bias when:
- The reasons for nonresponse are unrelated to the topic, for example when people decline mainly because of time pressure.
- Good auxiliary information exists on characteristics related to both response and the outcomes, allowing effective weighting.
- The analysis focuses on relationships or comparisons. Differences between groups or associations between variables are often less affected than overall levels, although they are not immune.
- The aim is to track change using consistent methods, so that any bias is similar at each point and largely cancels out.
Why the response rate is still worth reporting
None of this means the response rate can be ignored. It sets an upper limit on how much damage nonresponse can do: when 90% of a sample responds, even very different nonrespondents can shift an estimate only a little, whereas at 10% the potential for bias is much greater. A falling response rate over time can also signal changes in who is taking part. And standard response rates allow surveys to be compared and audited (AAPOR, 2023). The response rate is best treated as one indicator of risk among several, reported alongside evidence about the composition of the responding sample.
Assessing nonresponse bias
Because the response rate alone says little, good practice is to look for direct evidence of bias. Several methods are widely used.
Compare with benchmarks. Compare the survey's estimates with reliable external figures, such as census data, administrative records or high-quality government surveys, for variables measured in both. Close agreement on variables related to the survey topic is reassuring; large differences are a warning.
Use sampling frame and paradata information. When the sampling frame contains information about all sampled cases, such as region or customer history, respondents and nonrespondents can be compared directly. Paradata, the records of the data collection process such as the number of contact attempts, also help. Kreuter (2013) describes how paradata can be used both to monitor fieldwork and to adjust estimates for nonresponse.
Compare early and late respondents. People who respond only after repeated reminders can be treated as a proxy for nonrespondents. If their answers differ from those of early respondents, nonrespondents may differ further still. This method is easy to apply, but its assumption that late respondents resemble nonrespondents does not always hold. Lin and Schaeffer (1995) tested it against record data available for the full sample and found that reluctant respondents were not a reliable stand-in for nonrespondents.
Follow up a sample of nonrespondents. An intensive follow-up of a random subsample of nonrespondents, sometimes with a shorter questionnaire or a larger incentive, provides direct evidence of how they differ.
Monitor the balance of response. Schouten et al. (2009) proposed the R-indicator, which measures how much response propensities vary across groups defined by known characteristics. A response that is evenly spread across groups, a "representative" response in their terminology, leaves less room for bias than an uneven one, even at the same response rate. The indicator shifts attention from how many people respond to who responds.
Reducing nonresponse bias
During data collection
The most effective strategies focus on reducing the imbalance in who responds, not simply on raising the response rate. Practical measures include:
- Clear, neutral invitations. Describe the survey in a way that does not appeal mainly to people with strong feelings about the topic, since this can encourage topic-driven participation (Groves et al., 2000).
- Incentives. Incentives can bring in people with little interest in the topic, who might otherwise be absent. Singer and Ye (2013) reviewed the evidence and found that incentives consistently raise response rates, with prepaid cash incentives generally the most effective.
- Multiple modes and contacts. Offering web, telephone and paper options, and using reminders at different times, reaches different kinds of people (Dillman et al., 2014).
- Targeted effort. Directing extra follow-up towards under-represented groups, rather than spreading it evenly, improves balance more efficiently. Responsive design formalises this approach: fieldwork is monitored in phases and adjusted to control errors and costs (Groves & Heeringa, 2006).
- Short, well-designed questionnaires. Reducing the burden on respondents helps retain those with less interest or time.
After data collection
Once data are collected, the main tool is weighting. Respondents are given weights so that the weighted sample matches the population on characteristics known from reliable sources, such as age, sex, region and education. Weighting can remove much of the bias caused by common causes, provided the weighting variables are related both to the likelihood of response and to the survey's outcomes (Kalton & Flores-Cervantes, 2003). Its success depends mainly on auxiliary variables strongly related to both response and outcomes (Brick, 2013). Weighting cannot remove bias caused by factors that are not included in the weights, and it increases the variance of estimates, especially when weights are very unequal (Lohr, 2021).
More advanced methods model response propensities directly, or use statistical models for the missing information. Little and Rubin (2019) set out the formal conditions under which such methods work. The central requirement is that, after accounting for the variables included in the model, whether someone responds is unrelated to their answers. Researchers can never fully verify this assumption, which is why careful design and independent benchmarks remain important.
A worked example
Consider a hypothetical customer survey for a software company. The company invites a random sample of 2,000 customers and 500 respond, a response rate of 25%. Among respondents, 70% say they are satisfied. Should the company trust that figure?
The company's records allow it to compare respondents and nonrespondents on two things it already knows: how long each customer has been with the company and whether they contacted support in the past year. Respondents turn out to be similar to nonrespondents in support contact, but long-standing customers are over-represented: 60% of respondents have been customers for more than three years, compared with 40% of the sample as a whole. Longer-standing customers are also more satisfied, at 78% compared with 58% among newer customers.
This is a common-cause situation. Tenure affects both who responds and how satisfied they are. Weighting respondents so that the tenure mix matches the full sample, 40% long-standing and 60% newer, gives an estimate of 0.4 × 78% + 0.6 × 58%, or 66%, four points lower than the unweighted figure. The company can be reasonably confident in the adjusted estimate for satisfaction, because the variable driving response is measured and has been corrected.
It should be more cautious about other questions. If the survey also asked how likely customers are to recommend the product to others, and if customers with strong opinions, positive or negative, are more inclined to answer surveys about the product, that estimate may be biased in ways that tenure weighting does not fix. The same survey, with the same response rate, can therefore produce one well-corrected estimate and one that remains uncertain. This is exactly the pattern Groves and Peytcheva (2008) found across many studies: bias is a property of the estimate, not of the survey.
Implications for commissioning and using survey data
For organisations that commission or use surveys, this research suggests a set of practical questions to ask, in place of the single question "what was the response rate?":
- How was the sample drawn, and who could have been included? Coverage of the population comes before response.
- Who responded, and how do they compare with the population? Look for comparisons with reliable benchmarks.
- Could the topic have influenced who took part? Consider how the survey was described to potential respondents.
- How were the data weighted, and on which variables? Check that weighting variables are relevant to the questions asked.
- How do key estimates compare with other sources? Agreement with independent data on related measures is strong evidence of quality.
- What is the purpose of the estimate? A precise level, a comparison between groups and a trend over time carry different levels of risk.
Conclusion
Falling response rates are a real challenge for survey research, but they are not the same thing as falling accuracy. Decades of experiments and meta-analysis show that the response rate is a weak guide to nonresponse bias, and that bias depends mainly on whether the reasons people respond are connected with the answers they would give. Low response rates matter when the topic drives participation, when respondents differ from nonrespondents in ways that cannot be corrected, and when the goal is a precise estimate of a level. They matter much less when the causes of nonresponse are unrelated to the topic and good auxiliary information is available for weighting. The practical lesson is to judge survey quality by evidence about who responded and how well the results agree with independent sources, not by a single number.
References
Abraham, K. G., Helms, S., & Presser, S. (2009). How social processes distort measurement: The impact of survey nonresponse on estimates of volunteer work in the United States. American Journal of Sociology, 114(4), 1129–1165. https://doi.org/10.1086/595945
American Association for Public Opinion Research. (2023). Standard definitions: Final dispositions of case codes and outcome rates for surveys (10th ed.). https://aapor.org/wp-content/uploads/2023/05/Standards-Definitions-10th-edition.pdf
Brick, J. M. (2013). Unit nonresponse and weighting adjustments: A critical review. Journal of Official Statistics, 29(3), 329–353. https://doi.org/10.2478/jos-2013-0026
Brick, J. M., & Williams, D. (2013). Explaining rising nonresponse rates in cross-sectional surveys. The Annals of the American Academy of Political and Social Science, 645(1), 36–59. https://doi.org/10.1177/0002716212456834
Curtin, R., Presser, S., & Singer, E. (2000). The effects of response rate changes on the index of consumer sentiment. Public Opinion Quarterly, 64(4), 413–428. https://doi.org/10.1086/318638
Dillman, D. A., Smyth, J. D., & Christian, L. M. (2014). Internet, phone, mail, and mixed-mode surveys: The tailored design method (4th ed.). Wiley. https://doi.org/10.1002/9781394260645
Groves, R. M. (2006). Nonresponse rates and nonresponse bias in household surveys. Public Opinion Quarterly, 70(5), 646–675. https://doi.org/10.1093/poq/nfl033
Groves, R. M., & Couper, M. P. (1998). Nonresponse in household interview surveys. Wiley. https://doi.org/10.1002/9781118490082
Groves, R. M., Couper, M. P., Presser, S., Singer, E., Tourangeau, R., Acosta, G. P., & Nelson, L. (2006). Experiments in producing nonresponse bias. Public Opinion Quarterly, 70(5), 720–736. https://doi.org/10.1093/poq/nfl036
Groves, R. M., & Heeringa, S. G. (2006). Responsive design for household surveys: Tools for actively controlling survey errors and costs. Journal of the Royal Statistical Society: Series A (Statistics in Society), 169(3), 439–457. https://doi.org/10.1111/j.1467-985X.2006.00423.x
Groves, R. M., & Peytcheva, E. (2008). The impact of nonresponse rates on nonresponse bias: A meta-analysis. Public Opinion Quarterly, 72(2), 167–189. https://doi.org/10.1093/poq/nfn011
Groves, R. M., Presser, S., & Dipko, S. (2004). The role of topic interest in survey participation decisions. Public Opinion Quarterly, 68(1), 2–31. https://doi.org/10.1093/poq/nfh002
Groves, R. M., Singer, E., & Corning, A. (2000). Leverage-saliency theory of survey participation. Public Opinion Quarterly, 64(3), 299–308. https://doi.org/10.1086/317990
Kalton, G., & Flores-Cervantes, I. (2003). Weighting methods. Journal of Official Statistics, 19(2), 81–98.
Keeter, S., Kennedy, C., Dimock, M., Best, J., & Craighill, P. (2006). Gauging the impact of growing nonresponse on estimates from a national RDD telephone survey. Public Opinion Quarterly, 70(5), 759–779. https://doi.org/10.1093/poq/nfl035
Keeter, S., Miller, C., Kohut, A., Groves, R. M., & Presser, S. (2000). Consequences of reducing nonresponse in a national telephone survey. Public Opinion Quarterly, 64(2), 125–148. https://doi.org/10.1086/317759
Kennedy, C., & Hartig, H. (2019, February 27). Response rates in telephone surveys have resumed their decline. Pew Research Center. https://www.pewresearch.org/short-reads/2019/02/27/response-rates-in-telephone-surveys-have-resumed-their-decline/
Kreuter, F. (Ed.). (2013). Improving surveys with paradata: Analytic uses of process information. Wiley. https://doi.org/10.1002/9781118596869
Lin, I.-F., & Schaeffer, N. C. (1995). Using survey participants to estimate the impact of nonparticipation. Public Opinion Quarterly, 59(2), 236–258. https://doi.org/10.1086/269471
Little, R. J. A., & Rubin, D. B. (2019). Statistical analysis with missing data (3rd ed.). Wiley. https://doi.org/10.1002/9781119482260
Lohr, S. L. (2021). Sampling: Design and analysis (3rd ed.). CRC Press. https://doi.org/10.1201/9780429298899
Peytchev, A. (2013). Consequences of survey nonresponse. The Annals of the American Academy of Political and Social Science, 645(1), 88–111. https://doi.org/10.1177/0002716212461748
Schouten, B., Cobben, F., & Bethlehem, J. (2009). Indicators for the representativeness of survey response. Survey Methodology, 35(1), 101–113.
Singer, E., & Ye, C. (2013). The use and effects of incentives in surveys. The Annals of the American Academy of Political and Social Science, 645(1), 112–141. https://doi.org/10.1177/0002716212458082
Williams, D., & Brick, J. M. (2018). Trends in U.S. face-to-face household survey nonresponse and level of effort. Journal of Survey Statistics and Methodology, 6(2), 186–211. https://doi.org/10.1093/jssam/smx019