
Surveys · Nonresponse, weighting and data quality
Unit Nonresponse Versus Item Nonresponse: Causes and Remedies
Surveys lose information in two ways. Some sampled people do not take part at all, and some who take part skip particular questions. This article explains the difference between unit and item nonresponse, their causes, the bias each can create and the remedies available before and after data collection.
No survey obtains every answer from every sampled person. Missing information takes two main forms. Unit nonresponse occurs when a sampled person, household or business provides no usable data at all: they cannot be contacted, refuse to take part or are unable to respond. Item nonresponse occurs when someone takes part but leaves particular questions unanswered, because they decline, do not know or skip them by mistake (Groves et al., 2009).
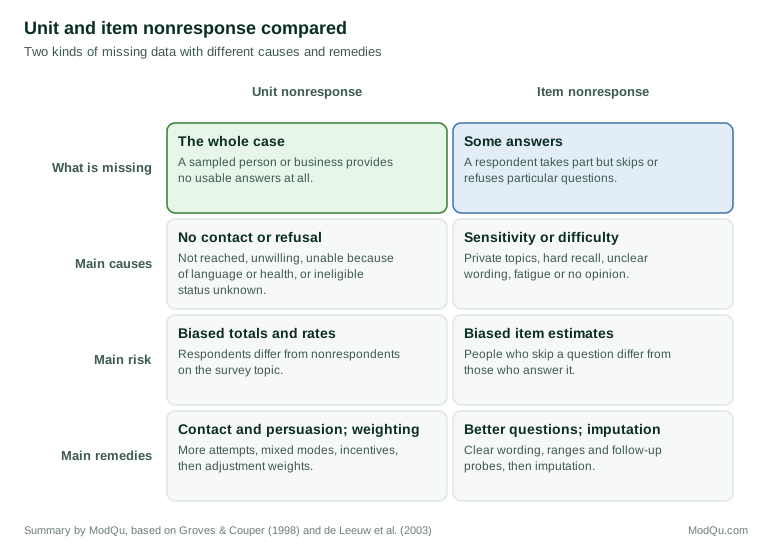
The two forms are related but have different causes and call for different remedies. Unit nonresponse is addressed mainly through fieldwork and weighting. Item nonresponse is addressed mainly through questionnaire design and imputation. Both can bias survey estimates if the people or answers that are missing differ from those that are observed (Groves, 2006; Little & Rubin, 2019). This article explains the two forms, their causes and the remedies available to researchers. Figure 1 summarises the main differences.
Unit nonresponse
Causes
Unit nonresponse has three main components (Groves & Couper, 1998; American Association for Public Opinion Research, 2023):
- Noncontact. The survey never reaches the sampled person. Letters go unread, calls go unanswered and interviewers find no one at home.
- Refusal. The person is reached but declines to take part, either explicitly or by not responding to repeated requests.
- Inability. The person would take part but cannot, because of language, illness, disability or absence during the fieldwork period.
Each component has its own drivers. Contact depends on how and when people can be reached, which is shaped by household size, working hours and the type of dwelling. Cooperation depends on how people weigh the request. Groves et al. (1992) argued that people decide quickly whether to take part, using cues such as the sponsor, the interviewer's manner and the perceived burden. The leverage-saliency theory holds that different features of a survey request, such as the topic, the sponsor or an incentive, matter more to some people than to others, and that the decision depends on which features are prominent when the request is made (Groves et al., 2000).
Bias from unit nonresponse
Unit nonresponse causes bias when the reasons people do not respond are related to what the survey measures. A survey about volunteering will overstate volunteering if people who volunteer are also more willing to answer surveys. A survey about working hours will understate long hours if people who work long hours are harder to contact (Groves, 2006). The response rate alone does not show whether bias is present. Groves and Peytcheva (2008) found that bias varied more between questions within the same survey than between surveys with different response rates.
Remedies
Remedies for unit nonresponse fall into two groups: reducing it during fieldwork and adjusting for it afterwards.
During fieldwork, researchers can increase contact by making more attempts at different times and days and by using several modes of contact, such as mail followed by telephone or a visit (Dillman et al., 2014). They can increase cooperation by sending advance letters, explaining the purpose and value of the survey, offering incentives and assuring confidentiality. Singer and Ye (2013) reviewed experiments on incentives and found that they consistently increase response, with prepaid cash incentives usually more effective than promised ones. Singer et al. (1995) found that confidentiality assurances modestly improved response, especially for sensitive surveys.
After fieldwork, researchers adjust survey weights so that respondents represent nonrespondents with similar characteristics. Weighting-class adjustments divide the sample into groups with similar response propensities and increase the weights of respondents in groups with lower response. Calibration and raking then align the weighted sample with known population totals (Kalton & Flores-Cervantes, 2003). These adjustments reduce bias only to the extent that the variables used explain both response and the survey outcomes.
Item nonresponse
Causes
Item nonresponse arises when a respondent who has agreed to take part does not answer a question. Beatty and Herrmann (2002) described the decision to answer as depending on what the respondent knows, how well they can retrieve and express it, and whether they are willing to report it. Item nonresponse can therefore reflect several distinct situations:
- Not knowing. The respondent does not have the information, such as the exact value of household savings, or has no opinion on the topic.
- Difficulty. The question requires effort, recall or calculation that the respondent is unwilling or unable to provide (Krosnick, 1991).
- Sensitivity. The question asks about private or potentially embarrassing matters, such as income, health or illegal behaviour, and the respondent prefers not to answer (Tourangeau & Yan, 2007).
- Design problems. Unclear routing, confusing wording or a layout that hides a question causes respondents to skip it unintentionally.
- Breakoff. In self-administered surveys, respondents who stop partway through leave all later questions unanswered (Peytchev, 2009).
"Don't know" and refusal are different responses with different meanings. Shoemaker et al. (2002) found that "don't know" answers were more common for questions requiring knowledge or effort, while refusals were more common for sensitive questions. Distinguishing them in the data helps researchers understand why answers are missing.
Which questions are skipped
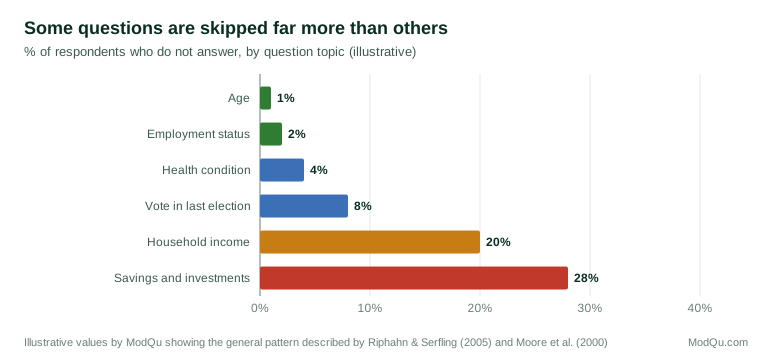
Item nonresponse is concentrated on certain kinds of question. Financial questions are among the most affected. Income and wealth questions commonly have nonresponse rates many times higher than demographic questions (Moore et al., 2000; Riphahn & Serfling, 2005). Figure 2 illustrates the general pattern.
Bias from item nonresponse
Item nonresponse creates bias when people who skip a question differ from those who answer it in ways related to the answer. People with very high or very low incomes may be more likely to decline income questions, so that the observed income distribution is too narrow (Riphahn & Serfling, 2005). Kim et al. (2007) found that people who did not report income in a health survey differed from those who did on several health and social characteristics, so that analyses excluding them could be misleading.
Missing data theory describes three situations (Rubin, 1976; Little & Rubin, 2019). Data are missing completely at random when the chance of an answer being missing is unrelated to anything, observed or not. They are missing at random when the chance is related to observed characteristics, such as age or education, but not to the missing value itself once those are taken into account. They are missing not at random when the chance depends on the missing value, for example when people with high incomes are more likely to refuse income questions even after accounting for their other characteristics. Most adjustment methods assume data are missing at random. When that assumption fails, some bias remains.
Remedies
Better question design is the first remedy. Clear wording, sensible routing and a logical order reduce unintentional skipping. For sensitive and difficult items, several techniques help:
- Ranges and brackets. Asking for income within ranges rather than exact amounts reduces refusals. Unfolding brackets, a sequence of questions such as "Is it more than $50,000?" followed by further ranges, recover partial information from people who decline to give an exact figure (Juster & Smith, 1997).
- Self-administration. People report sensitive information more readily when they do not have to say it to an interviewer (Tourangeau & Yan, 2007).
- Explaining why. A brief explanation of why a question is asked and how answers are protected can reduce refusals.
- Follow-up probes. Interviewers or online prompts can ask once more when an answer is skipped, without pressing.
In online surveys, researchers sometimes require an answer before respondents can continue. Forced answering removes item nonresponse but can increase breakoff and lead to less accurate answers from people who would rather not answer. Décieux et al. (2015) found that forced answering raised dropout rates. A softer approach prompts respondents once and then allows them to continue, and offers explicit "prefer not to say" options for sensitive items.
Imputation fills in missing values after data collection. Simple methods replace missing values with averages or with values from similar respondents. Hot-deck imputation, for example, takes the value from a respondent who matches on key characteristics. Model-based methods predict missing values from other variables. Multiple imputation creates several plausible values for each missing item and combines results across them, so that the uncertainty caused by missing data is reflected in standard errors (Rubin, 1987; Little & Rubin, 2019). Brick and Kalton (1996) reviewed methods for handling missing data in surveys and recommended imputation for item nonresponse and weighting for unit nonresponse as general principles.
Complete-case analysis, which simply drops respondents with missing answers, is the default in many software packages. It is unbiased only if data are missing completely at random, and it reduces the sample size. For variables with substantial missing data, it is usually inferior to imputation (Little & Rubin, 2019).
How the two forms interact
Unit and item nonresponse are linked. Efforts to persuade reluctant people to take part may bring in respondents who then skip more questions or answer less carefully. Olson (2013) reviewed studies of this issue and found mixed evidence: in some surveys, reluctant respondents provided lower-quality data, while in others the differences were small. The trade-off should be considered when deciding how hard to push for a higher response rate.
The boundary between the two forms is also not always sharp. A respondent who answers the first few questions and then stops has partly responded. Survey organisations must decide how many answers are needed for a case to count as a respondent, and that rule affects both the response rate and the amount of item nonresponse. AAPOR's standard definitions distinguish complete and partial interviews for this reason (American Association for Public Opinion Research, 2023).
Weighting or imputation?
Weighting and imputation address different gaps, but the choice between them is sometimes open. When a respondent answers only a few questions, the researcher can treat the case as unit nonresponse and adjust weights, or treat it as a respondent with many missing items and impute them. Weighting is simpler and keeps all reported values unchanged, but it uses only the variables available for both respondents and nonrespondents. Imputation can draw on everything the respondent did report, which often includes variables closely related to the missing items, but it creates values that were never observed (Brick & Kalton, 1996).
A common practice is to set a threshold, such as answers to all core questions, below which a case is treated as nonresponse. Cases above the threshold are kept, and their missing items are imputed. Whatever rule is used, it should be stated in the documentation so that users know which values are reported and which were filled in.
In business surveys
Business and organisational surveys show the same two forms of nonresponse, with some differences. Unit nonresponse is often concentrated among small firms, which have fewer staff to complete questionnaires, while large firms may respond because they are used to statutory reporting. Item nonresponse tends to fall on questions that require information from several departments, such as detailed costs or employment by category, and on commercially sensitive items such as profit margins and prices. Allowing respondents to give estimates, naming the records that hold the information and offering a contact for help can reduce both forms. Because a few large businesses can dominate totals, imputation for a missing large respondent is often based on its own earlier reports or on administrative data rather than on similar firms.
Item nonresponse in longitudinal surveys
In surveys that follow the same people over time, item nonresponse can be addressed with information from earlier waves. If a respondent reported their income last year but declines this year, last year's value, adjusted for typical change, provides a strong basis for imputation. Respondents who skip a sensitive item once often answer it in another wave, so patterns of missing data over time can also show whether nonresponse is related to particular circumstances, such as a change in employment.
An example
A survey of household finances obtains responses from 52 per cent of sampled households. Comparing respondents and nonrespondents on frame data shows that renters and younger households are under-represented, so the team adjusts weights for tenure and age. Among respondents, 18 per cent do not give an exact household income. Follow-up bracket questions recover a range for two thirds of these, leaving 6 per cent with no income information. The team uses multiple imputation, drawing on the brackets, employment status, education and housing costs, to fill in exact values. Median income after imputation is 4 per cent higher than the median among those who gave an exact figure, which suggests that higher-income households were more likely to decline the exact question (illustrative example).
Reporting nonresponse
Good practice is to report both forms. For unit nonresponse, report response, contact and cooperation rates calculated according to a recognised standard, along with the steps taken to reduce and adjust for nonresponse (American Association for Public Opinion Research, 2023). For item nonresponse, report the share of missing answers for key variables, how "don't know" and refusal were treated and which imputation method was used. Users can then judge how much the results depend on assumptions about the missing data (de Leeuw et al., 2003).
Conclusion
Unit and item nonresponse are two ways in which surveys lose information. Unit nonresponse removes whole cases and is driven by contact and cooperation. Item nonresponse removes particular answers and is driven by knowledge, difficulty, sensitivity and design. Both can bias results when what is missing differs from what is observed. Careful fieldwork and weighting address unit nonresponse; careful question design and imputation address item nonresponse. Treating them as distinct problems, with distinct causes and remedies, leads to more accurate survey knowledge.
References
American Association for Public Opinion Research. (2023). Standard definitions: Final dispositions of case codes and outcome rates for surveys (10th ed.). AAPOR. https://aapor.org/standards-and-ethics/standard-definitions/
Beatty, P., & Herrmann, D. (2002). To answer or not to answer: Decision processes related to survey item nonresponse. In R. M. Groves, D. A. Dillman, J. L. Eltinge, & R. J. A. Little (Eds.), Survey nonresponse (pp. 71–85). Wiley.
Brick, J. M., & Kalton, G. (1996). Handling missing data in survey research. Statistical Methods in Medical Research, 5(3), 215–238. https://doi.org/10.1177/096228029600500302
Décieux, J. P., Mergener, A., Neufang, K. M., & Sischka, P. (2015). Implementation of the forced answering option within online surveys: Do higher item response rates come at the expense of participation and answer quality? Psihologija, 48(4), 311–326. https://doi.org/10.2298/PSI1504311D
de Leeuw, E. D., Hox, J., & Huisman, M. (2003). Prevention and treatment of item nonresponse. Journal of Official Statistics, 19(2), 153–176.
Dillman, D. A., Smyth, J. D., & Christian, L. M. (2014). Internet, phone, mail, and mixed-mode surveys: The tailored design method (4th ed.). Wiley.
Groves, R. M., & Couper, M. P. (1998). Nonresponse in household interview surveys. Wiley. https://doi.org/10.1002/9781118490082
Groves, R. M., & Peytcheva, E. (2008). The impact of nonresponse rates on nonresponse bias: A meta-analysis. Public Opinion Quarterly, 72(2), 167–189. https://doi.org/10.1093/poq/nfn011
Groves, R. M. (2006). Nonresponse rates and nonresponse bias in household surveys. Public Opinion Quarterly, 70(5), 646–675. https://doi.org/10.1093/poq/nfl033
Groves, R. M., Cialdini, R. B., & Couper, M. P. (1992). Understanding the decision to participate in a survey. Public Opinion Quarterly, 56(4), 475–495. https://doi.org/10.1086/269338
Groves, R. M., Fowler, F. J., Jr., Couper, M. P., Lepkowski, J. M., Singer, E., & Tourangeau, R. (2009). Survey methodology (2nd ed.). Wiley.
Groves, R. M., Singer, E., & Corning, A. (2000). Leverage-saliency theory of survey participation: Description and an illustration. Public Opinion Quarterly, 64(3), 299–308. https://doi.org/10.1086/317990
Juster, F. T., & Smith, J. P. (1997). Improving the quality of economic data: Lessons from the HRS and AHEAD. Journal of the American Statistical Association, 92(440), 1268–1278. https://doi.org/10.1080/01621459.1997.10473648
Kalton, G., & Flores-Cervantes, I. (2003). Weighting methods. Journal of Official Statistics, 19(2), 81–97.
Kim, S., Egerter, S., Cubbin, C., Takahashi, E. R., & Braveman, P. (2007). Potential implications of missing income data in population-based surveys: An example from a postpartum survey in California. Public Health Reports, 122(6), 753–763. https://doi.org/10.1177/003335490712200607
Krosnick, J. A. (1991). Response strategies for coping with the cognitive demands of attitude measures in surveys. Applied Cognitive Psychology, 5(3), 213–236. https://doi.org/10.1002/acp.2350050305
Little, R. J. A., & Rubin, D. B. (2019). Statistical analysis with missing data (3rd ed.). Wiley. https://doi.org/10.1002/9781119482260
Moore, J. C., Stinson, L. L., & Welniak, E. J., Jr. (2000). Income measurement error in surveys: A review. Journal of Official Statistics, 16(4), 331–361.
Olson, K. (2013). Do non-response follow-ups improve or reduce data quality? A review of the existing literature. Journal of the Royal Statistical Society: Series A, 176(1), 129–145. https://doi.org/10.1111/j.1467-985X.2012.01042.x
Peytchev, A. (2009). Survey breakoff. Public Opinion Quarterly, 73(1), 74–97. https://doi.org/10.1093/poq/nfp014
Riphahn, R. T., & Serfling, O. (2005). Item non-response on income and wealth questions. Empirical Economics, 30(2), 521–538. https://doi.org/10.1007/s00181-005-0247-7
Rubin, D. B. (1976). Inference and missing data. Biometrika, 63(3), 581–592. https://doi.org/10.1093/biomet/63.3.581
Rubin, D. B. (1987). Multiple imputation for nonresponse in surveys. Wiley. https://doi.org/10.1002/9780470316696
Shoemaker, P. J., Eichholz, M., & Skewes, E. A. (2002). Item nonresponse: Distinguishing between don't know and refuse. International Journal of Public Opinion Research, 14(2), 193–201. https://doi.org/10.1093/ijpor/14.2.193
Singer, E., & Ye, C. (2013). The use and effects of incentives in surveys. The Annals of the American Academy of Political and Social Science, 645(1), 112–141. https://doi.org/10.1177/0002716212458082
Singer, E., Von Thurn, D. R., & Miller, E. R. (1995). Confidentiality assurances and response: A quantitative review of the experimental literature. Public Opinion Quarterly, 59(1), 66–77. https://doi.org/10.1086/269458
Tourangeau, R., & Yan, T. (2007). Sensitive questions in surveys. Psychological Bulletin, 133(5), 859–883. https://doi.org/10.1037/0033-2909.133.5.859