
Surveys · Nonresponse, weighting and data quality
The Decline in Survey Response Rates and What It Means for Accuracy
Survey response rates have fallen for decades across countries and modes. This article describes the decline, explains its causes and sets out what the evidence says about its effect on the accuracy of survey estimates.
A survey's response rate is the share of eligible sampled people who complete it. For much of the twentieth century, well-run household surveys routinely achieved response rates of 70 per cent or more. Since then, response rates have fallen steadily in most countries and for most kinds of survey (de Leeuw & de Heer, 2002; Luiten et al., 2020). Telephone surveys that once reached a third or more of sampled numbers now often complete interviews with fewer than one in ten (Kennedy & Hartig, 2019).
This decline raises an obvious question: if most sampled people do not respond, can survey results still be trusted? The answer is more nuanced than it first appears. A low response rate increases the risk of bias but does not by itself show that results are biased (Groves, 2006; Groves & Peytcheva, 2008). This article describes the decline, explains its causes and summarises what the evidence shows about its consequences for accuracy.
The scale of the decline
Evidence of falling response rates comes from many sources. Curtin et al. (2005) documented a steady fall in response to a long-running telephone survey of consumer attitudes in the United States over a quarter of a century. De Leeuw and de Heer (2002) compared official household surveys in 16 countries and found that response rates fell in most of them, and that refusals rose faster than noncontacts. Williams and Brick (2018) found that response rates in major face-to-face household surveys in the United States declined even as the effort spent on fieldwork increased. Luiten et al. (2020) studied surveys in 25 countries and found continued declines into the twenty-first century. Meyer et al. (2015) showed that falling response was accompanied by more missing answers and lower-quality reports in major government surveys.
The decline has been steepest for telephone surveys. Caller identification, the move from landlines to mobile phones and the volume of unwanted calls have made people less likely to answer unknown numbers (Dutwin & Lavrakas, 2016; Kennedy & Hartig, 2019). Figure 1 illustrates the general pattern across modes.
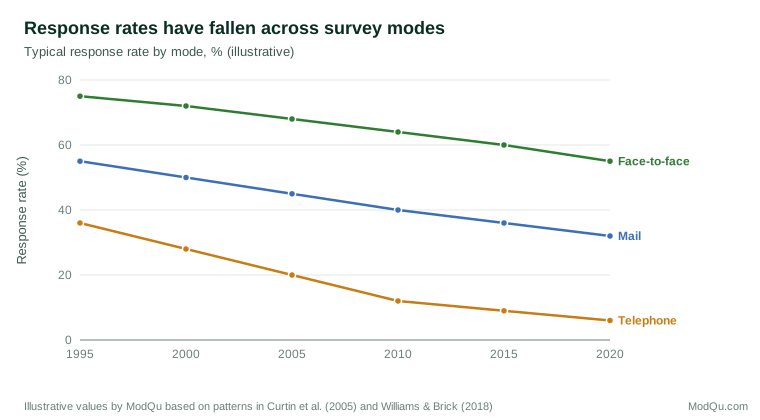
Some surveys have resisted the trend through intensive fieldwork. Analyses of the European Social Survey found that response rates varied widely between countries and depended strongly on the effort put into fieldwork, such as the number of contact attempts and interviewer training (Stoop et al., 2010). Maintaining response, however, has become steadily more expensive (Williams & Brick, 2018).
Why response rates have fallen
Nonresponse has two main components: failure to contact sampled people and refusal by those who are contacted. Both have grown (Groves & Couper, 1998; Brick & Williams, 2013). Figure 2 summarises four broad causes.
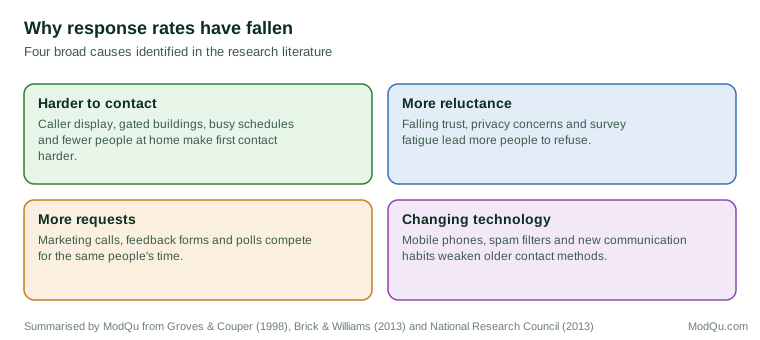
Contact has become harder because of changes in how people live and communicate. More people live alone, work irregular hours or live in buildings with controlled entry. Telephone screening, spam filters and the decline of landlines have weakened traditional methods of reaching people (Brick & Williams, 2013; National Research Council, 2013).
Refusal has grown as people receive more requests for their time and information. Marketing calls, customer feedback surveys and online polls compete with research surveys, and many people do not distinguish between them. Concerns about privacy, data security and fraud lead some to avoid unknown contacts altogether. Brick and Williams (2013) found that rising nonresponse was related to social changes such as increases in single-person households and declining civic engagement.
Does a low response rate mean bias?
Nonresponse causes bias only when the people who respond differ from those who do not on the things the survey measures. The bias in an estimate depends on two factors: the size of the nonresponding group and how different it is from respondents. A survey with a low response rate can be nearly unbiased if nonrespondents resemble respondents on the measures of interest. A survey with a high response rate can be biased if the few nonrespondents are very different (Groves, 2006).
Evidence supports this distinction. Groves and Peytcheva (2008) analysed 59 studies that measured nonresponse bias directly and found that the response rate explained little of the variation in bias between estimates. Bias varied more between questions within a survey than between surveys with different response rates. Keeter et al. (2006) compared a standard telephone survey with a more rigorous version that achieved a much higher response rate and found few significant differences in results. Curtin et al. (2000) found that excluding hard-to-reach respondents had little effect on an index of consumer sentiment.
This does not mean that response rates are unimportant. Low response increases the room for bias, and some estimates are badly affected. Keeter et al. (2017) found that a low-response telephone survey matched benchmarks well on many measures but overstated civic and political engagement, because people who take part in surveys are also more likely to volunteer, vote and contact officials. Topics related to the decision to respond, such as interest in the survey subject, are particularly at risk (Groves, 2006).
What it means for accuracy
The decline in response rates has three main consequences for the accuracy of survey knowledge.
Greater reliance on adjustment. As response falls, survey results depend more on weighting and other adjustments to correct for differences between respondents and the population. These adjustments work only when the variables used are related both to response and to the survey measures (National Research Council, 2013).
More attention to bias, not rates. Researchers increasingly assess nonresponse bias directly, by comparing respondents with nonrespondents on frame variables, comparing early and late respondents, or comparing estimates with external benchmarks. A response rate alone is a weak indicator of quality (Groves & Peytcheva, 2008).
Higher cost. Maintaining response requires more contact attempts, incentives, mixed modes and interviewer effort. Each additional percentage point of response costs more than the last, so researchers must judge whether the gain in accuracy justifies the expense (Williams & Brick, 2018).
How survey organisations have responded
Survey organisations have adapted in several ways. Many have moved from telephone to address-based designs that invite people by mail to respond online, with paper or telephone follow-up, which can achieve higher response at lower cost than telephone alone (Olson et al., 2021). Incentives, particularly small unconditional payments sent with the first letter, have become more common because they reliably increase response (National Research Council, 2013). Some organisations use responsive designs, monitoring fieldwork as it happens and changing contact strategies for groups that are responding poorly, so that effort is directed where it most reduces bias rather than simply raising the overall rate (Groves & Heeringa, 2006).
Others have turned to online panels and other nonprobability sources, which do not have response rates in the usual sense. These sources avoid the cost of contacting a probability sample but introduce selection problems of their own, and their accuracy depends heavily on adjustment (Dutwin & Buskirk, 2017).
In business surveys
Business and organisational surveys face similar trends. Firms receive many requests from government agencies, trade bodies and commercial researchers, and responding takes staff time. Response tends to be lowest among small firms and highest among large firms that are used to statutory reporting. Because large firms account for most economic activity, a survey can have a low response rate by count of firms but cover a high share of turnover or employment. Reporting both measures gives a clearer picture of coverage.
Reporting response rates
Because response rates are calculated in several ways, reporting should follow a recognised standard. The American Association for Public Opinion Research (2023) defines response rates and related outcome rates, such as contact and cooperation rates, and explains how to treat cases of unknown eligibility. Reporting these figures, along with the steps taken to assess bias, allows readers to judge a survey's quality.
An example
A regional agency has run an annual household survey for 20 years. Its response rate has fallen from 68 per cent to 41 per cent. Before deciding whether to change the design, the agency compares respondents and nonrespondents on information from the sampling frame, such as area, dwelling type and household size. It finds that renters and single-person households are under-represented among recent respondents, and that these groups differ on several key measures. The agency adds a reminder by text message, offers a small incentive to renters and adjusts its weights for tenure and household size. A comparison with census data shows that the adjusted estimates are close to census values on the variables that can be checked (illustrative example).
Conclusion
Survey response rates have fallen across countries and modes, driven by greater difficulty of contact and growing reluctance to take part. The decline increases the risk of nonresponse bias, raises costs and makes surveys more dependent on statistical adjustment. Yet the evidence shows that response rates are a poor guide to bias on their own. Accurate knowledge from surveys now depends on assessing who is missing, how they differ and whether adjustments can correct for them.
References
American Association for Public Opinion Research. (2023). Standard definitions: Final dispositions of case codes and outcome rates for surveys (10th ed.). AAPOR. https://aapor.org/standards-and-ethics/standard-definitions/
Brick, J. M., & Williams, D. (2013). Explaining rising nonresponse rates in cross-sectional surveys. The Annals of the American Academy of Political and Social Science, 645(1), 36–59. https://doi.org/10.1177/0002716212456834
Curtin, R., Presser, S., & Singer, E. (2000). The effects of response rate changes on the index of consumer sentiment. Public Opinion Quarterly, 64(4), 413–428. https://doi.org/10.1086/318638
Curtin, R., Presser, S., & Singer, E. (2005). Changes in telephone survey nonresponse over the past quarter century. Public Opinion Quarterly, 69(1), 87–98. https://doi.org/10.1093/poq/nfi002
de Leeuw, E., & de Heer, W. (2002). Trends in household survey nonresponse: A longitudinal and international comparison. In R. M. Groves, D. A. Dillman, J. L. Eltinge, & R. J. A. Little (Eds.), Survey nonresponse (pp. 41–54). Wiley.
Dutwin, D., & Buskirk, T. D. (2017). Apples to oranges or gala versus golden delicious? Comparing data quality of nonprobability internet samples to low response rate probability samples. Public Opinion Quarterly, 81(S1), 213–239. https://doi.org/10.1093/poq/nfw061
Dutwin, D., & Lavrakas, P. (2016). Trends in telephone outcomes, 2008–2015. Survey Practice, 9(3). https://doi.org/10.29115/SP-2016-0017
Groves, R. M., & Couper, M. P. (1998). Nonresponse in household interview surveys. Wiley. https://doi.org/10.1002/9781118490082
Groves, R. M., & Heeringa, S. G. (2006). Responsive design for household surveys: Tools for actively controlling survey errors and costs. Journal of the Royal Statistical Society: Series A, 169(3), 439–457. https://doi.org/10.1111/j.1467-985X.2006.00423.x
Groves, R. M., & Peytcheva, E. (2008). The impact of nonresponse rates on nonresponse bias: A meta-analysis. Public Opinion Quarterly, 72(2), 167–189. https://doi.org/10.1093/poq/nfn011
Groves, R. M. (2006). Nonresponse rates and nonresponse bias in household surveys. Public Opinion Quarterly, 70(5), 646–675. https://doi.org/10.1093/poq/nfl033
Keeter, S., Hatley, N., Kennedy, C., & Lau, A. (2017). What low response rates mean for telephone surveys. Pew Research Center. https://www.pewresearch.org/methods/2017/05/15/what-low-response-rates-mean-for-telephone-surveys/
Keeter, S., Kennedy, C., Dimock, M., Best, J., & Craighill, P. (2006). Gauging the impact of growing nonresponse on estimates from a national RDD telephone survey. Public Opinion Quarterly, 70(5), 759–779. https://doi.org/10.1093/poq/nfl035
Kennedy, C., & Hartig, H. (2019). Response rates in telephone surveys have resumed their decline. Pew Research Center.
Luiten, A., Hox, J., & de Leeuw, E. (2020). Survey nonresponse trends and fieldwork effort in the 21st century: Results of an international study across countries and surveys. Journal of Official Statistics, 36(3), 469–487. https://doi.org/10.2478/jos-2020-0025
Meyer, B. D., Mok, W. K. C., & Sullivan, J. X. (2015). Household surveys in crisis. Journal of Economic Perspectives, 29(4), 199–226. https://doi.org/10.1257/jep.29.4.199
National Research Council. (2013). Nonresponse in social science surveys: A research agenda (R. Tourangeau & T. J. Plewes, Eds.). The National Academies Press. https://doi.org/10.17226/18293
Olson, K., Smyth, J. D., Horwitz, R., Keeter, S., Lesser, V., Marken, S., Mathiowetz, N. A., McCarthy, J. S., O'Brien, E., Opsomer, J. D., Steiger, D., Sterrett, D., Su, J., Suzer-Gurtekin, Z. T., Turakhia, C., & Wagner, J. (2021). Transitions from telephone surveys to self-administered and mixed-mode surveys: AAPOR task force report. Journal of Survey Statistics and Methodology, 9(3), 381–411. https://doi.org/10.1093/jssam/smz062
Stoop, I., Billiet, J., Koch, A., & Fitzgerald, R. (2010). Improving survey response: Lessons learned from the European Social Survey. Wiley. https://doi.org/10.1002/9780470688335
Williams, D., & Brick, J. M. (2018). Trends in US face-to-face household survey nonresponse and level of effort. Journal of Survey Statistics and Methodology, 6(2), 186–211. https://doi.org/10.1093/jssam/smx019