
Surveys · Nonresponse, weighting and data quality
Propensity Score Adjustment for Online Survey Samples
Online opt-in samples differ from the population in ways that demographic weighting does not fully correct. Propensity score adjustment uses a reference probability sample to model who joins online samples and weights accordingly. This article explains how the method works, what it needs and what the evidence shows.
Online opt-in panels and other volunteer samples are fast and inexpensive, but the people in them choose to take part. They tend to differ from the general population not only in age, sex and education but also in internet use, interests and attitudes (Bethlehem, 2010; Baker et al., 2013). Weighting to demographic totals corrects some of these differences but often leaves bias in estimates related to the characteristics that led people to join.
Propensity score adjustment is one response. It borrows an idea from the analysis of observational studies, where Rosenbaum and Rubin (1983) showed that comparing groups with the same probability of receiving a treatment, given their characteristics, can remove bias from those characteristics. Applied to surveys, the "treatment" is membership of the online sample. By modelling the probability that a person with given characteristics is in the online sample rather than in the population, researchers can weight online respondents to represent the population more closely (Lee, 2006; Valliant & Dever, 2011).
How it works
Propensity score adjustment requires a reference sample: a probability sample of the target population that asks some of the same questions as the online survey. The reference sample may be a separate survey conducted for the purpose or an existing high-quality survey (Lee, 2006; Schonlau et al., 2009). Figure 1 summarises the steps.
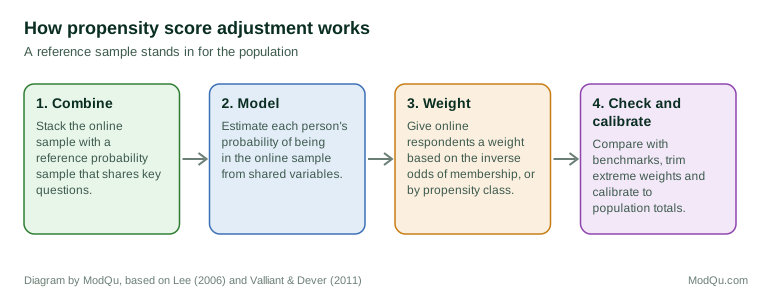
- Combine the samples. The online sample and the reference sample are stacked into one file, with an indicator of which sample each person came from. Reference respondents carry their design weights.
- Model membership. A model, usually logistic regression, estimates each person's probability of being in the online sample given variables measured in both samples. This probability is the propensity score.
- Weight. Online respondents receive weights that increase the influence of people with low propensity scores, who are under-represented, and reduce the influence of those with high scores. Weights are often based on the inverse odds of membership, or respondents are grouped into five or more classes of similar propensity and weighted so that each class matches its share of the reference sample (Lee, 2006; Valliant & Dever, 2011).
- Check and calibrate. Weights are examined for extreme values, trimmed if needed and often calibrated to population totals on demographic variables (Lee & Valliant, 2009).
Choosing the variables
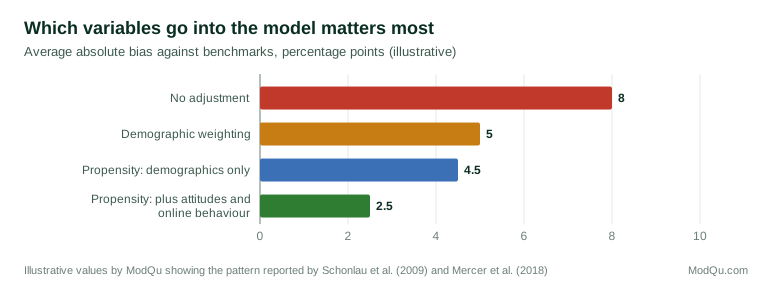
The method's success depends on the variables in the model. They must explain why people are in the online sample and must be related to the survey outcomes. Demographic variables alone are usually not enough, because people of the same age, sex and education differ in their likelihood of joining an online panel (Schonlau et al., 2009).
Researchers have therefore added so-called webographic or attitudinal questions: items about internet use, early adoption of technology, interest in politics, willingness to take risks and other characteristics thought to distinguish online volunteers. Taylor (2000) described an early commercial application in which such questions were asked in both a telephone reference survey and an online survey. Schonlau et al. (2007) tested whether webographic questions improved adjustment and found mixed results: they helped for some estimates but not others. Figure 2 illustrates the general pattern reported across studies.
What the evidence shows
Studies comparing propensity-adjusted online estimates with benchmarks show that the method usually reduces bias but rarely removes it. Schonlau et al. (2009) compared an online panel with a probability-based survey and found that propensity adjustment reduced bias for many variables, but substantial differences remained for some. Loosveldt and Sonck (2008) evaluated weighting procedures for an online access panel in Belgium and found that neither demographic weighting nor propensity adjustment fully removed differences from a face-to-face survey. Lee and Valliant (2009) showed in simulations that combining propensity adjustment with calibration performed better than either alone.
Mercer et al. (2018) compared several weighting methods for online opt-in samples, including raking, matching and propensity weighting, and concluded that the choice of variables mattered more than the method. Valliant (2020) compared a range of estimators for nonprobability samples and found that their performance depended mainly on whether the model captured the relevant differences between the sample and the population.
Limitations
Propensity score adjustment has several limitations (Valliant & Dever, 2011; Elliott & Valliant, 2017):
- It needs a good reference sample. The reference sample must measure the model variables in the same way as the online survey. If modes differ, for example a telephone reference and a web survey, answers to attitudinal questions may differ because of the mode, not the people.
- It cannot correct for what it does not measure. If people join online panels for reasons unrelated to the model variables but related to the outcomes, bias remains (Mercer et al., 2017).
- It can increase variance. Propensity weights can vary widely, which reduces the effective sample size (Kish, 1992). The reference sample's own sampling error also adds to the uncertainty of the final estimates.
- Overlap is required. For each kind of person in the population, some must be in the online sample. If a group is almost absent, no weight can represent it.
Recent developments
Newer methods build on the same idea. Doubly robust estimators combine propensity weights with models of the survey outcome, giving valid results if either model is correct (Chen et al., 2020). Machine learning methods, such as classification trees and random forests, can estimate propensities with fewer assumptions about the form of the relationships. All of these approaches still depend on a reference sample and on variables that capture the differences between the online sample and the population (Elliott & Valliant, 2017).
Practical guidance
Several practices improve the results of propensity score adjustment:
- Plan the shared questions in advance. Choose variables likely to explain panel membership and the survey outcomes, and ask them with identical wording in both samples.
- Use the same mode where possible. Fielding the reference survey online, for example through a probability-based web panel, reduces mode differences in answers to attitudinal questions.
- Refresh the reference sample. The make-up of online panels changes over time, so a reference sample collected years earlier may no longer describe the differences correctly.
- Check balance. After weighting, compare the online and reference samples on the model variables. Remaining differences show where the model has not done its job.
- Test against benchmarks. Include a few questions with known population values that were not used in the model, and check whether adjusted estimates come close to them (Mercer et al., 2018).
- Report the method. State the reference sample, the model variables, the weighting approach and the size of the design effect, so that users can judge the results.
An example
A company runs a monthly online survey about consumer spending using an opt-in panel. Once a year, it commissions a probability-based reference survey of 1,000 adults that includes demographic questions, frequency of internet use, number of online purchases in the past month and attitudes towards new products. Combining the two samples, it fits a model of panel membership and creates five propensity classes. Within each class, panel respondents are weighted to match the reference sample's share, and the weights are then calibrated to census totals by age, sex and region. Before adjustment, the panel's estimate of the share of adults who bought clothing online in the past month is 14 points higher than the reference survey's; after adjustment, the gap is 3 points (illustrative example).
Conclusion
Propensity score adjustment uses a reference probability sample to model and correct the self-selection in online samples. It can reduce bias more than demographic weighting alone, especially when the model includes variables related to internet use and topic interest. It does not remove all bias, it depends on a high-quality reference sample, and it can increase variance. Used with care and with honest reporting of its assumptions, it is a valuable tool for drawing population knowledge from online samples.
References
Baker, R., Brick, J. M., Bates, N. A., Battaglia, M., Couper, M. P., Dever, J. A., Gile, K. J., & Tourangeau, R. (2013). Summary report of the AAPOR task force on non-probability sampling. Journal of Survey Statistics and Methodology, 1(2), 90–143. https://doi.org/10.1093/jssam/smt008
Bethlehem, J. (2010). Selection bias in web surveys. International Statistical Review, 78(2), 161–188. https://doi.org/10.1111/j.1751-5823.2010.00112.x
Chen, Y., Li, P., & Wu, C. (2020). Doubly robust inference with nonprobability survey samples. Journal of the American Statistical Association, 115(532), 2011–2021. https://doi.org/10.1080/01621459.2019.1677241
Elliott, M. R., & Valliant, R. (2017). Inference for nonprobability samples. Statistical Science, 32(2), 249–264. https://doi.org/10.1214/16-STS598
Kish, L. (1992). Weighting for unequal P<sub>i</sub>. Journal of Official Statistics, 8(2), 183–200.
Lee, S., & Valliant, R. (2009). Estimation for volunteer panel web surveys using propensity score adjustment and calibration adjustment. Sociological Methods & Research, 37(3), 319–343. https://doi.org/10.1177/0049124108329643
Lee, S. (2006). Propensity score adjustment as a weighting scheme for volunteer panel web surveys. Journal of Official Statistics, 22(2), 329–349.
Loosveldt, G., & Sonck, N. (2008). An evaluation of the weighting procedures for an online access panel survey. Survey Research Methods, 2(2), 93–105. https://doi.org/10.18148/srm/2008.v2i2.82
Mercer, A., Lau, A., & Kennedy, C. (2018). For weighting online opt-in samples, what matters most? Pew Research Center.
Mercer, A. W., Kreuter, F., Keeter, S., & Stuart, E. A. (2017). Theory and practice in nonprobability surveys: Parallels between causal inference and survey inference. Public Opinion Quarterly, 81(S1), 250–271. https://doi.org/10.1093/poq/nfw060
Rosenbaum, P. R., & Rubin, D. B. (1983). The central role of the propensity score in observational studies for causal effects. Biometrika, 70(1), 41–55. https://doi.org/10.1093/biomet/70.1.41
Schonlau, M., van Soest, A., & Kapteyn, A. (2007). Are "webographic" or attitudinal questions useful for adjusting estimates from web surveys using propensity scoring? Survey Research Methods, 1(3), 155–163. https://doi.org/10.18148/srm/2007.v1i3.70
Schonlau, M., van Soest, A., Kapteyn, A., & Couper, M. (2009). Selection bias in web surveys and the use of propensity scores. Sociological Methods & Research, 37(3), 291–318. https://doi.org/10.1177/0049124108327128
Taylor, H. (2000). Does internet research work? International Journal of Market Research, 42(1), 51–63. https://doi.org/10.1177/147078530004200104
Valliant, R., & Dever, J. A. (2011). Estimating propensity adjustments for volunteer web surveys. Sociological Methods & Research, 40(1), 105–137. https://doi.org/10.1177/0049124110392533
Valliant, R. (2020). Comparing alternatives for estimation from nonprobability samples. Journal of Survey Statistics and Methodology, 8(2), 231–263. https://doi.org/10.1093/jssam/smz003