
Surveys · Foundations and history
The Evolution of Survey Modes: Face-to-Face, Telephone, Mail and Web
Surveys have moved from the doorstep to the telephone, the mailbox and the smartphone. This article traces each shift, explains how the mode of data collection affects who answers and what they say, and sets out how researchers choose and combine modes today.
The way a survey question reaches a respondent is called its mode. For most of the twentieth century the dominant mode was an interviewer sitting in the respondent's home. Telephone interviewing replaced it for many purposes from the 1970s, the web began to replace the telephone from the late 1990s, and smartphones have since changed the web survey itself. Each shift was driven by cost and technology, and each changed not only how surveys were done but also who could be reached and how people answered.
Understanding modes matters for anyone who uses survey data. Two surveys that ask the same question in different modes can produce different answers, and the choice of mode shapes which errors a survey is most exposed to. This article traces the history of the four main modes, summarises what research shows about their effects, and explains why most serious surveys now combine more than one.
Face-to-face interviewing
The first scientific surveys relied on interviewers who travelled to selected addresses and asked the questions in person. Face-to-face interviewing has several enduring strengths. Area probability sampling, in which researchers select geographic areas, then blocks or streets, then dwellings, can cover almost the entire household population without needing a list of names. Interviewers can find addresses, persuade reluctant people to take part, explain difficult questions, use show cards, and keep respondents engaged through long questionnaires. As a result, face-to-face surveys have historically achieved the highest response rates and can sustain interviews lasting an hour or more (Groves et al., 2009).
Face-to-face surveys remain the reference standard for many official statistics. Large government household surveys of employment, health and living conditions still use interviewers for at least part of their fieldwork, because no other mode can reach almost every household and sustain long, detailed interviews with acceptable response.
The disadvantages are cost and time. Interviewers must be recruited, trained, paid to travel and supervised across a wide area. Interviewers also influence answers. Respondents give more socially acceptable answers to a person than to a form, and different interviewers obtain systematically different answers to the same questions (Holbrook et al., 2003).
From the 1980s, paper questionnaires were replaced by laptop computers. Computer-assisted personal interviewing made complex routing automatic and reduced data-entry errors. A further development, computer-assisted self-interviewing, let respondents enter answers to sensitive questions privately on the interviewer's computer, sometimes while listening to the questions through headphones. In a well-known experiment with adolescent boys, this private audio mode produced much higher reporting of sensitive behaviours, such as drug use and sexual activity, than a paper questionnaire (Turner et al., 1998).
Telephone interviewing
Telephone surveys became practical once almost every household had a landline. Their breakthrough came with random digit dialling, which generates telephone numbers at random within working exchanges, so that unlisted numbers have the same chance of selection as listed ones. Waksberg (1978) developed an efficient two-stage version that greatly reduced the number of calls wasted on non-working numbers. Early comparisons showed that telephone surveys could produce estimates broadly similar to personal interviews at a fraction of the cost (Groves & Kahn, 1979).
Central call centres brought further advantages. Computer-assisted telephone interviewing allowed close supervision, standardised delivery and fast turnaround, and by the 1980s and 1990s telephone surveys dominated opinion polling and much market research (Groves, 1990).
Telephone interviewing has its own measurement profile. Without visual aids, respondents must hold response options in memory, which favours the last options heard. Interviews tend to be shorter and conversations faster. Holbrook et al. (2003) compared national telephone and face-to-face samples answering long questionnaires and found that telephone respondents showed more signs of satisficing, such as non-differentiated answers and more "no opinion" responses, and were more likely to give socially desirable answers.
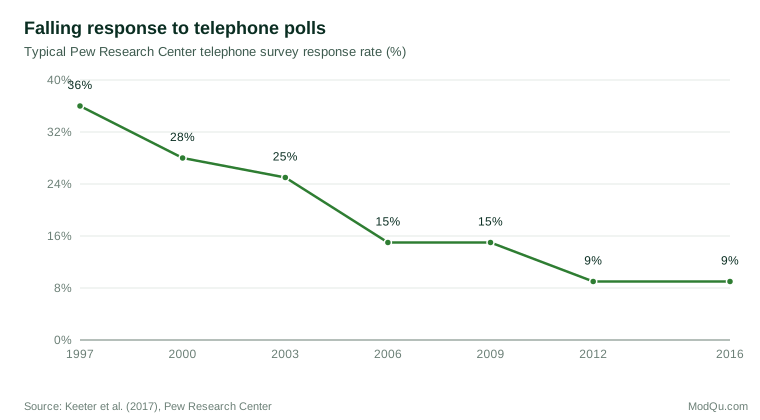
The telephone era was undermined by social and technical change. Caller identification, answering machines and growing resistance to unsolicited calls drove response rates down, while the shift to mobile phones meant that landline samples missed a growing share of the population, especially younger adults. Pew Research Center reported that the response rate for its typical telephone surveys fell from 36% in 1997 to 9% by 2012 and remained around that level in 2016 (Keeter et al., 2017). Brick and Williams (2013) documented similar declines across many types of cross-sectional surveys and linked them to broader changes in society, including rising suspicion of strangers and more crowded lives. Pew found that its low-response telephone polls still produced accurate estimates for many political and demographic measures, but costs per completed interview rose steeply as more and more calls were needed.
Mail questionnaires
Mailed questionnaires are older than the telephone survey but were long regarded as a low-quality option because of poor response rates. Don Dillman changed that view. His "total design method" set out detailed rules for every element of a mail survey, from the wording of the cover letter to the number and timing of follow-up mailings, and showed that general population mail surveys could achieve response rates comparable to those of interview surveys (Dillman, 1978). Later versions of the approach, renamed the tailored design method, extended the same principles to web and mixed-mode surveys (Dillman et al., 2014).
Mail surveys are self-administered, which removes interviewer effects and encourages more candid answers to sensitive questions. Respondents can see all the response options and answer at their own pace. The limitations are slow turnaround, limited control over the order in which questions are answered, and a need for respondents who can read and are willing to write.
Mail has enjoyed a revival as telephone surveys declined. Postal address files now cover nearly all households in many countries, providing a frame for address-based sampling. Link et al. (2008) found that an address-based mail survey reached more households and achieved a higher response rate than a parallel random digit dial telephone survey. Mail contact is now often used to invite sampled households to complete a questionnaire online, combining the coverage of an address frame with the low cost of web data collection (Messer & Dillman, 2011).
Web surveys
The internet transformed survey economics. Once a web questionnaire is programmed, the marginal cost of each additional respondent is close to zero, results arrive in real time, and the questionnaire can include images, video, randomisation and complex routing. Couper (2000) noted early that these advantages came with a serious problem: there is no general list of internet users from which to draw a random sample, so many web surveys rely on volunteers. The quality of a web survey therefore depends heavily on how its respondents are recruited.
Web surveys also tend to obtain lower response rates than other modes when the same population is invited. A meta-analysis of experiments comparing web with other modes found that web response rates were on average about 11 percentage points lower (Lozar Manfreda et al., 2008), and an updated meta-analysis reached a similar estimate of about 12 points (Daikeler et al., 2020).
On the measurement side, web surveys share the strengths of self-administration. People report sensitive behaviour more frankly on the web than in interviewer-administered modes (Kreuter et al., 2008), echoing earlier findings that self-administration increases reports of sensitive behaviours (Tourangeau & Smith, 1996). Chang and Krosnick (2009) compared parallel telephone and internet surveys and found that the internet samples gave answers with less social desirability bias and more internal consistency, although the composition of the samples differed. Tourangeau et al. (2013) review a large body of experiments showing that the visual design of web questionnaires, including the layout of response options, the use of grids and the presence of progress indicators, affects how people answer.
Online panels
The web also changed how samples are assembled. Because there is no list of all internet users, many organisations recruit online panels: large groups of people who have agreed to take part in surveys from time to time. Panels differ greatly in how they are built. Opt-in panels recruit volunteers through advertising and websites, and their quality depends on how well the volunteers can be adjusted to resemble the population. Probability-based panels recruit members through random sampling of addresses or telephone numbers, provide devices or internet access to people who lack them, and then interview members online. The second approach restores a known chance of selection while keeping most of the cost advantages of the web, and several national research organisations now rely on it for their main surveys of the public (Olson et al., 2021).
Panels bring their own issues. Members who stay for years may become practised respondents whose answers differ from those of first-time participants, and panels lose members over time, so their composition must be monitored and refreshed. They also make it possible to choose the mode for each study on the basis of a known group of people, which is a considerable advantage when results must be compared over time.
Automated voice and text
Two further modes sit between the telephone and the web. In interactive voice response, a recorded voice reads the questions and respondents answer by pressing keys or speaking. Removing the live interviewer reduces cost and, like other self-administered modes, makes people more willing to report sensitive behaviour. Kreuter et al. (2008) found that reporting of undesirable information was higher in interactive voice response than in interviewer-administered telephone interviews, though lower than on the web. Text messaging is the newest variant, and early experiments suggest it combines the convenience of the phone with the privacy of self-completion (Schober et al., 2015).
The smartphone era
By the 2010s a growing share of web survey respondents were answering on smartphones, whether or not the survey had been designed for them. Small screens make long grids, wide scales and lengthy text hard to read, and mobile respondents are more likely to break off or answer in shortened ways when questionnaires are not adapted (Couper, 2017). At the same time, smartphones open new possibilities: short "in the moment" surveys, location data, photographs and voice responses. In one experiment, people answering questions by text message on their phones gave more precise answers and disclosed more sensitive information than people answering the same questions in voice interviews (Schober et al., 2015).
Mode effects
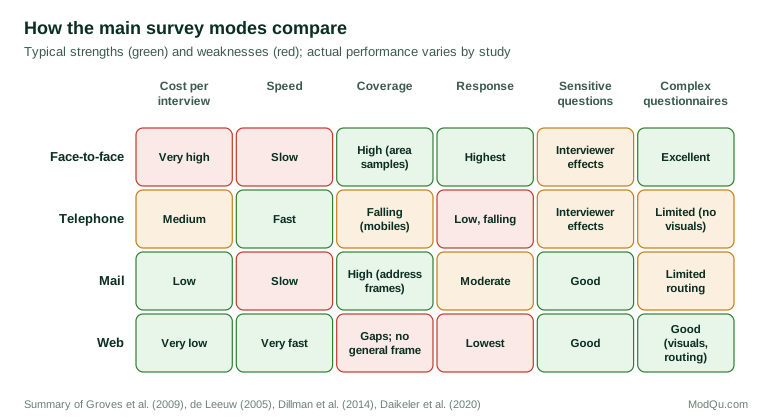
Because each mode differs in how questions are presented and who presents them, the same question can produce different answers by mode. These mode effects come from three main sources (de Leeuw, 2005):
- Presence of an interviewer. Interviewer-administered modes encourage socially desirable answers and help keep respondents motivated. Self-administered modes encourage candour but leave respondents to cope with difficult questions alone.
- Channel of communication. Questions that are heard rather than seen favour later response options and make long lists harder to remember. Visual presentation favours earlier options and allows more complex formats.
- Who is reached. Each mode reaches a different mix of people, so differences between modes may reflect who responded as well as how they answered.
Mode effects are not uniform across questions. Factual items with clear answers, such as age or household size, usually show little difference between modes. Attitude questions, sensitive behaviours and questions with many response options are much more susceptible, because they depend on how the question is perceived and how comfortable the respondent feels. Researchers comparing results across modes should therefore look closely at the type of question before concluding that a difference reflects a real change in the population.
Separating the measurement effect from the selection effect is difficult, because people are rarely assigned to modes at random. Careful experiments, however, consistently show that self-administered modes produce higher reports of sensitive or stigmatised behaviour and lower reports of desirable behaviour than interviewer-administered modes (Tourangeau & Smith, 1996; Kreuter et al., 2008).
Mixing modes
Because no single mode is best on every criterion, most major surveys now combine modes. De Leeuw (2005) distinguishes several reasons for doing so: to reduce cost by starting with a cheap mode and following up nonrespondents in a more expensive one; to improve coverage by offering a mode that reaches people missed by another; and to reduce measurement error by using self-administration for sensitive sections within an interview.
Mixing modes involves trade-offs. A sequential design that starts with the web and follows up by mail or telephone can raise response and lower cost, but if the modes measure differently, the combined estimates mix two kinds of measurement. Designers try to minimise this by writing questions that work the same way across modes, an approach Dillman et al. (2014) call unified mode construction.
An American Association for Public Opinion Research task force reviewed the move away from telephone surveys and concluded that transitions to self-administered and mixed-mode designs can maintain quality, but that changing modes in a long-running survey can create apparent changes in trends that are really caused by the change in method (Olson et al., 2021). Organisations that track measures over time need to plan mode changes carefully, ideally by running old and new modes in parallel for a period so that the break can be measured.
Choosing a mode today
Couper (2011) argued that the future of data collection lies not in a single dominant mode but in choosing and combining modes to fit each study. In practice, the choice depends on a few questions:
- What frame is available? An email list supports a web survey; an address list supports mail or mail-to-web; a general population survey without a list may require address-based or panel recruitment.
- How sensitive are the questions? Self-administration generally yields more honest answers.
- How complex and long is the questionnaire? Long, complex instruments benefit from interviewers or careful web design; smartphone respondents need short, simple layouts.
- How fast are results needed, and what is the budget? Web is fastest and cheapest; face-to-face is slowest and most expensive.
- Will results be compared with past data? A change of mode may need a parallel run to measure its effect.
In business research the most common answer today is a web questionnaire designed to work on both computers and smartphones, sometimes supplemented by telephone or mail follow-up for groups that are hard to reach online.
Conclusion
The history of survey modes is a history of trade-offs between cost, coverage, cooperation and measurement. Face-to-face interviewing offered coverage and depth at high cost; the telephone offered speed and economy until people stopped answering; mail returned as a reliable route to every address; and the web made surveys cheap and fast while raising new questions about who responds. No mode is neutral. Each shapes who answers and how they answer. Knowing the mode behind a set of survey results, and how it might have influenced them, is an essential part of interpreting the numbers correctly.
References
Brick, J. M., & Williams, D. (2013). Explaining rising nonresponse rates in cross-sectional surveys. The Annals of the American Academy of Political and Social Science, 645(1), 36–59. https://doi.org/10.1177/0002716212456834
Chang, L., & Krosnick, J. A. (2009). National surveys via RDD telephone interviewing versus the internet: Comparing sample representativeness and response quality. Public Opinion Quarterly, 73(4), 641–678. https://doi.org/10.1093/poq/nfp075
Couper, M. P. (2000). Web surveys: A review of issues and approaches. Public Opinion Quarterly, 64(4), 464–494. https://doi.org/10.1086/318641
Couper, M. P. (2011). The future of modes of data collection. Public Opinion Quarterly, 75(5), 889–908. https://doi.org/10.1093/poq/nfr046
Couper, M. P. (2017). New developments in survey data collection. Annual Review of Sociology, 43, 121–145. https://doi.org/10.1146/annurev-soc-060116-053613
Daikeler, J., Bošnjak, M., & Lozar Manfreda, K. (2020). Web versus other survey modes: An updated and extended meta-analysis comparing response rates. Journal of Survey Statistics and Methodology, 8(3), 513–539. https://doi.org/10.1093/jssam/smz008
de Leeuw, E. D. (2005). To mix or not to mix data collection modes in surveys. Journal of Official Statistics, 21(2), 233–255.
Dillman, D. A. (1978). Mail and telephone surveys: The total design method. Wiley.
Dillman, D. A., Smyth, J. D., & Christian, L. M. (2014). Internet, phone, mail, and mixed-mode surveys: The tailored design method (4th ed.). Wiley.
Groves, R. M., & Kahn, R. L. (1979). Surveys by telephone: A national comparison with personal interviews. Academic Press.
Groves, R. M. (1990). Theories and methods of telephone surveys. Annual Review of Sociology, 16, 221–240. https://doi.org/10.1146/annurev.so.16.080190.001253
Groves, R. M., Fowler, F. J., Jr., Couper, M. P., Lepkowski, J. M., Singer, E., & Tourangeau, R. (2009). Survey methodology (2nd ed.). Wiley.
Holbrook, A. L., Green, M. C., & Krosnick, J. A. (2003). Telephone versus face-to-face interviewing of national probability samples with long questionnaires: Comparisons of respondent satisficing and social desirability response bias. Public Opinion Quarterly, 67(1), 79–125. https://doi.org/10.1086/346010
Keeter, S., Hatley, N., Kennedy, C., & Lau, A. (2017). What low response rates mean for telephone surveys. Pew Research Center. https://www.pewresearch.org/methods/2017/05/15/what-low-response-rates-mean-for-telephone-surveys/
Kreuter, F., Presser, S., & Tourangeau, R. (2008). Social desirability bias in CATI, IVR, and web surveys: The effects of mode and question sensitivity. Public Opinion Quarterly, 72(5), 847–865. https://doi.org/10.1093/poq/nfn063
Link, M. W., Battaglia, M. P., Frankel, M. R., Osborn, L., & Mokdad, A. H. (2008). A comparison of address-based sampling (ABS) versus random-digit dialing (RDD) for general population surveys. Public Opinion Quarterly, 72(1), 6–27. https://doi.org/10.1093/poq/nfn003
Lozar Manfreda, K., Bosnjak, M., Berzelak, J., Haas, I., & Vehovar, V. (2008). Web surveys versus other survey modes: A meta-analysis comparing response rates. International Journal of Market Research, 50(1), 79–104. https://doi.org/10.1177/147078530805000107
Messer, B. L., & Dillman, D. A. (2011). Surveying the general public over the internet using address-based sampling and mail contact procedures. Public Opinion Quarterly, 75(3), 429–457. https://doi.org/10.1093/poq/nfr021
Olson, K., Smyth, J. D., Horwitz, R., Keeter, S., Lesser, V., Marken, S., Mathiowetz, N. A., McCarthy, J. S., O'Brien, E., Opsomer, J. D., Steiger, D., Sterrett, D., Su, J., Suzer-Gurtekin, Z. T., Turakhia, C., & Wagner, J. (2021). Transitions from telephone surveys to self-administered and mixed-mode surveys: AAPOR task force report. Journal of Survey Statistics and Methodology, 9(3), 381–411. https://doi.org/10.1093/jssam/smz062
Schober, M. F., Conrad, F. G., Antoun, C., Ehlen, P., Fail, S., Hupp, A. L., Johnston, M., Vickers, L., Yan, H. Y., & Zhang, C. (2015). Precision and disclosure in text and voice interviews on smartphones. PLOS ONE, 10(6), e0128337. https://doi.org/10.1371/journal.pone.0128337
Tourangeau, R., & Smith, T. W. (1996). Asking sensitive questions: The impact of data collection mode, question format, and question context. Public Opinion Quarterly, 60(2), 275–304. https://doi.org/10.1086/297751
Tourangeau, R., Conrad, F. G., & Couper, M. P. (2013). The science of web surveys. Oxford University Press. https://doi.org/10.1093/acprof:oso/9780199747047.001.0001
Turner, C. F., Ku, L., Rogers, S. M., Lindberg, L. D., Pleck, J. H., & Sonenstein, F. L. (1998). Adolescent sexual behavior, drug use, and violence: Increased reporting with computer survey technology. Science, 280(5365), 867–873. https://doi.org/10.1126/science.280.5365.867
Waksberg, J. (1978). Sampling methods for random digit dialing. Journal of the American Statistical Association, 73(361), 40–46. https://doi.org/10.1080/01621459.1978.10479995