
Surveys · Foundations and history
Survey Research as a Social Science Method: Strengths, Limits and Purpose
What surveys are designed to do, why they became the most widely used method in social science, where their weaknesses lie, and how researchers combine them with other methods to get closer to the truth.
Surveys are so familiar that it is easy to forget they are a research method with a particular logic, particular strengths and particular blind spots. Governments use them to measure unemployment, health and crime. Businesses use them to understand customers and employees. Social scientists use them to study attitudes, inequality and political behaviour. In each case the survey offers the same promise: by asking a well-chosen set of people a standard set of questions, it is possible to describe and explain the characteristics of a much larger population.
This article examines that promise. It sets out what surveys are designed to do, what they do better than other methods, where they fall short, and how careful researchers compensate for their weaknesses.
What makes a survey a survey
Methodologists define a survey as a systematic method for gathering information from a sample of entities in order to construct quantitative descriptors of the attributes of the larger population of which they are members (Groves et al., 2009). Three features of that definition matter.
First, a survey is systematic: everyone selected is asked the same questions in the same way, so their answers can be compared and added up. Second, it usually studies a sample rather than everyone, chosen so that conclusions can be extended to the population. Third, it produces quantitative summaries, such as percentages, averages and relationships between variables, rather than detailed accounts of individual cases.
Sociologists have long pointed out that what defines the survey is less the questionnaire than the shape of the data it produces. Marsh (1982) argued that a survey is any study that collects the same variables for a structured set of cases, so that the variation between cases can be analysed systematically. On this view, the survey's characteristic contribution is the "variable by case" data matrix, which allows researchers to ask how characteristics are distributed and how they relate to one another across many people at once.
Three purposes
Surveys serve three broad purposes, often within the same study (de Vaus, 2013).
Description. The simplest and most common use is to estimate how many people in a population have some characteristic: the unemployment rate, the share of customers who would recommend a firm, the proportion of adults who support a policy. Description is the survey's greatest strength, because with a probability sample the accuracy of such estimates can be stated.
Explanation. Surveys are also used to explore why people differ. Researchers compare groups, for example older and younger voters, or customers who renew and those who leave, and use statistical models to estimate how much of the difference is associated with other characteristics. Early landmark studies of voting and of soldiers' attitudes in the Second World War established this analytical use of survey data (Lazarsfeld et al., 1944; Stouffer et al., 1949).
Tracking change. Repeating a survey over time with the same questions shows how a population is changing. Panel surveys, which return to the same people, go further and show how individuals change, which helps separate genuine shifts from changes in who is being asked.
The strengths of the survey method
Generalisation
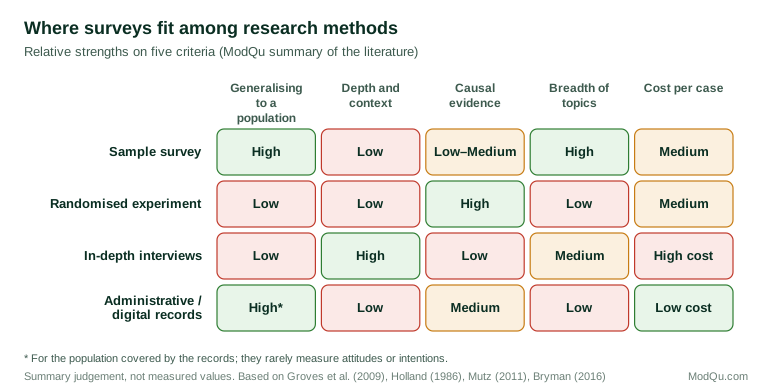
No other method can describe a large population as efficiently. A well-designed probability sample of a few thousand people can estimate national figures within a few percentage points, and the theory of sampling allows the uncertainty to be quantified (Groves et al., 2009). In-depth interviews and case studies can reveal how people think, but they cannot say how common those ways of thinking are.
Standardisation and comparability
Because every respondent receives the same questions, answers can be compared across groups, places and years. Standardisation also makes surveys replicable. Another researcher can ask the same questions of a new sample and check whether the results hold, a feature that is much harder to achieve with unstructured methods.
Breadth
A single questionnaire can cover behaviour, attitudes, knowledge, expectations and background characteristics. That breadth allows researchers to study how many factors relate to one another in the same people. Administrative records can be larger and more accurate for the facts they contain, but they rarely include opinions, intentions or reasons.
Access to the unobservable
Many of the things social scientists and businesses care about cannot be observed directly: trust, satisfaction, intention to buy, perceived fairness, political identity. Surveys are often the only practical way to measure them across a population.
Efficiency
Per piece of information collected, surveys are usually cheaper than observation, experiments or in-depth interviews, and online data collection has reduced costs further (Couper, 2017).
The limits of the survey method
Self-report
Almost everything a survey measures depends on what people say. Answering a question requires respondents to understand it, retrieve relevant information, form a judgement and map it onto the answer categories offered, and each of these steps introduces error (Tourangeau et al., 2000). Respondents under time pressure or with low motivation often "satisfice," giving an answer that is good enough rather than accurate (Krosnick, 1991). On sensitive topics people under-report undesirable behaviour and over-report desirable behaviour (Tourangeau & Yan, 2007), and the size of these distortions varies with the mode of data collection (Kreuter et al., 2008).
Self-reports about the reasons for behaviour are particularly fragile. Nisbett and Wilson (1977) reviewed experimental evidence that people often have little direct access to the causes of their own judgements and instead report plausible explanations that may not match what actually influenced them. A survey question that asks "why did you choose this product?" collects people's theories about their choices, which are valuable but not the same as the causes.
Question effects and non-attitudes
Survey answers can be surprisingly sensitive to the wording, order and format of questions. In a long series of split-sample experiments, Schuman and Presser (1981) showed that apparently minor changes, such as offering an explicit "no opinion" option or changing a single word, could shift the distribution of answers substantially. Converse (1964/2006) found that many respondents gave unstable answers to the same policy questions over time, as if choosing at random, and argued that surveys can record "non-attitudes": opinions created on the spot by the act of asking.
Attitudes and behaviour
What people say and what they do can diverge. LaPiere's (1934) classic study, in which establishments that had served a Chinese couple later said in a questionnaire that they would refuse such guests, has been debated for decades, but it remains a vivid warning that stated intentions are not behaviour.
Causal inference
Surveys are good at showing that two things go together and weak at showing that one causes the other. Respondents are not assigned to conditions at random, so groups that differ on one characteristic usually differ on many others. Statistical controls help but can only adjust for factors that were measured. Holland (1986) set out the formal reasons why associations in observational data cannot, on their own, establish causal effects.
Depth and context
Standardised questions trade depth for comparability. A closed question records which box a person ticked but not what they meant by it, how they arrived at it or how it fits into their life. Herbert Blumer criticised polling for treating public opinion as a set of isolated individual responses, each counted equally, rather than as something formed through interaction and organised groups (Blumer, 1948).
Who answers
Finally, a survey can only describe the people it reaches. Coverage gaps and nonresponse can bias results when the reasons for being excluded or not responding are related to the topics measured (Groves & Peytcheva, 2008). Falling response rates have made this concern more pressing, and some sociologists have argued that the dominance of the sample survey is being challenged by the growth of digital data generated as a by-product of everyday activity (Savage & Burrows, 2007).
Making surveys stronger
Researchers have developed several ways to address these limits without giving up the survey's strengths.
Survey experiments. Randomly assigning respondents to different versions of a question, scenario or message combines the generalisability of a population sample with the causal leverage of an experiment (Mutz, 2011). Gaines et al. (2007) caution that such experiments still need careful design, because effects observed in a questionnaire may not carry over to real-world settings, but they are now one of the most widely used tools in social science.
Panels. Following the same people over time allows researchers to observe the order in which changes occur and to compare each person with their own earlier answers, which removes the influence of stable individual characteristics. Lazarsfeld et al. (1944) pioneered the approach by interviewing the same voters repeatedly during an election campaign, which showed how few people actually changed their minds and how much the campaign reinforced existing leanings.
Better questions. Cognitive pretesting, careful wording and, for sensitive topics, self-administered modes all reduce measurement error (Tourangeau & Yan, 2007; Dillman et al., 2014).
Mixing methods. Qualitative interviews before a survey help researchers learn how people talk and think about a topic, so that questions are framed in respondents' terms. Interviews afterwards help interpret puzzling results. Bryman (2016) describes many designs in which qualitative and quantitative methods complement each other.
Linking data. Combining survey answers with administrative records, transactions or digital traces can check self-reports against behaviour and add information that people cannot easily report. Japec et al. (2015) argue that such combinations will become central to survey research, provided that the errors of each source are understood.
An example: explaining customer churn
A subscription business that wants to understand why customers cancel illustrates how these strengths and limits play out. Its own records show who cancelled and when, with complete accuracy, but say nothing about why. A survey of recent cancellers can measure satisfaction with price, service and product features, and can compare those who left with similar customers who stayed. That comparison will show which experiences are associated with leaving, and with a probability sample of customers the business can state how confident it is in the figures.
The survey cannot, on its own, prove that poor service caused people to leave. Customers who were already planning to cancel for other reasons may rate service more harshly after the fact, and the reasons people give for leaving may be the reasons that are easiest to state rather than the ones that mattered most (Nisbett & Wilson, 1977). The business gets a much stronger answer by linking the survey to its own records, so that ratings given before cancellation can be compared with later behaviour, and by testing a change, such as faster support, with a randomly chosen group of customers. The survey identifies the likely causes; the linked data and the experiment test them.
Why the survey endures
Despite its limits, the survey remains the most widely used method of quantitative social research. Groves (2011) describes how the method has adapted through successive eras, from face-to-face interviewing to telephone and web collection, and now to integration with other forms of data. Its endurance reflects a simple fact: for many questions about what a population thinks, experiences or intends, there is no other source. Administrative records show what happened but rarely why; digital traces show what people did online but rarely what they believe; experiments show causal effects but often in unrepresentative groups. Marsden and Wright (2010) note that survey research has become embedded in almost every area of social science and policy precisely because it can be adapted to so many questions.
For businesses that use survey data, understanding the method's logic has practical value. Surveys are most trustworthy when they are used for what they do best: describing a defined population on clearly measured characteristics, comparing groups, and tracking change with consistent questions. They need more caution when they are asked to explain motives, predict behaviour from stated intentions or establish cause and effect. Treating a survey result as one strong piece of evidence, to be combined with others, is the approach that social science has learned over almost a century of practice.
Conclusion
The survey is a powerful but specialised tool. Its strengths are generalisation, standardisation, breadth and the ability to measure what cannot be observed. Its weaknesses lie in its dependence on self-report, its sensitivity to question design, its limited causal leverage and its vulnerability to who answers. Knowing both sides allows researchers and decision-makers to design surveys that play to their strengths, to combine them with other evidence where they are weak, and to read survey results with the right mix of confidence and care.
References
Blumer, H. (1948). Public opinion and public opinion polling. American Sociological Review, 13(5), 542–549. https://doi.org/10.2307/2087146
Bryman, A. (2016). Social research methods (5th ed.). Oxford University Press.
Converse, P. E. (2006). The nature of belief systems in mass publics (1964). Critical Review, 18(1–3), 1–74. https://doi.org/10.1080/08913810608443650
Couper, M. P. (2017). New developments in survey data collection. Annual Review of Sociology, 43, 121–145. https://doi.org/10.1146/annurev-soc-060116-053613
de Vaus, D. (2013). Surveys in social research (6th ed.). Routledge. https://doi.org/10.4324/9780203519196
Dillman, D. A., Smyth, J. D., & Christian, L. M. (2014). Internet, phone, mail, and mixed-mode surveys: The tailored design method (4th ed.). Wiley.
Gaines, B. J., Kuklinski, J. H., & Quirk, P. J. (2007). The logic of the survey experiment reexamined. Political Analysis, 15(1), 1–20. https://doi.org/10.1093/pan/mpl008
Groves, R. M., & Peytcheva, E. (2008). The impact of nonresponse rates on nonresponse bias: A meta-analysis. Public Opinion Quarterly, 72(2), 167–189. https://doi.org/10.1093/poq/nfn011
Groves, R. M. (2011). Three eras of survey research. Public Opinion Quarterly, 75(5), 861–871. https://doi.org/10.1093/poq/nfr057
Groves, R. M., Fowler, F. J., Jr., Couper, M. P., Lepkowski, J. M., Singer, E., & Tourangeau, R. (2009). Survey methodology (2nd ed.). Wiley.
Holland, P. W. (1986). Statistics and causal inference. Journal of the American Statistical Association, 81(396), 945–960. https://doi.org/10.1080/01621459.1986.10478354
Japec, L., Kreuter, F., Berg, M., Biemer, P., Decker, P., Lampe, C., Lane, J., O'Neil, C., & Usher, A. (2015). Big data in survey research: AAPOR task force report. Public Opinion Quarterly, 79(4), 839–880. https://doi.org/10.1093/poq/nfv039
Kreuter, F., Presser, S., & Tourangeau, R. (2008). Social desirability bias in CATI, IVR, and web surveys: The effects of mode and question sensitivity. Public Opinion Quarterly, 72(5), 847–865. https://doi.org/10.1093/poq/nfn063
Krosnick, J. A. (1991). Response strategies for coping with the cognitive demands of attitude measures in surveys. Applied Cognitive Psychology, 5(3), 213–236. https://doi.org/10.1002/acp.2350050305
LaPiere, R. T. (1934). Attitudes vs. actions. Social Forces, 13(2), 230–237. https://doi.org/10.2307/2570339
Lazarsfeld, P. F., Berelson, B., & Gaudet, H. (1944). The people's choice: How the voter makes up his mind in a presidential campaign. Duell, Sloan and Pearce.
Marsden, P. V., & Wright, J. D. (Eds.). (2010). Handbook of survey research (2nd ed.). Emerald.
Marsh, C. (1982). The survey method: The contribution of surveys to sociological explanation. George Allen & Unwin.
Mutz, D. C. (2011). Population-based survey experiments. Princeton University Press.
Nisbett, R. E., & Wilson, T. D. (1977). Telling more than we can know: Verbal reports on mental processes. Psychological Review, 84(3), 231–259. https://doi.org/10.1037/0033-295X.84.3.231
Savage, M., & Burrows, R. (2007). The coming crisis of empirical sociology. Sociology, 41(5), 885–899. https://doi.org/10.1177/0038038507080443
Schuman, H., & Presser, S. (1981). Questions and answers in attitude surveys: Experiments on question form, wording, and context. Academic Press.
Stouffer, S. A., Suchman, E. A., DeVinney, L. C., Star, S. A., & Williams, R. M., Jr. (1949). The American soldier: Adjustment during army life (Vol. 1). Princeton University Press.
Tourangeau, R., & Yan, T. (2007). Sensitive questions in surveys. Psychological Bulletin, 133(5), 859–883. https://doi.org/10.1037/0033-2909.133.5.859
Tourangeau, R., Rips, L. J., & Rasinski, K. (2000). The psychology of survey response. Cambridge University Press. https://doi.org/10.1017/CBO9780511819322