
Surveys · Foundations and history
The Total Survey Error Framework: A Unified Model of Survey Quality
The margin of error reported with a survey covers only one source of inaccuracy. The total survey error framework sets out all the others, shows how they combine, and gives buyers and producers of survey data a practical way to judge quality.
Most published survey results come with a single number that describes their accuracy: the margin of error. A poll of 1,000 people is reported as accurate to within about three percentage points, 19 times out of 20. That figure is correct as far as it goes, but it describes only one way a survey can be wrong, namely the chance variation that comes from interviewing a sample rather than everyone. A survey can also be wrong because its list of people left some out, because the people who answered differ from those who did not, because a question was misunderstood, or because the data were coded or weighted badly. None of these errors appears in the margin of error.
The total survey error (TSE) framework is the survey profession's attempt to account for all of these sources together. It is less a formula than a way of thinking: a map of everything that can go wrong between the question a researcher wants answered and the number that is finally published. This article explains where the framework came from, how it is organised, what research shows about the size of the different errors, and how it can be used to judge the quality of any survey.
Where the idea came from
The idea that sampling error is only part of the story is almost as old as modern sampling itself. In 1944 W. Edwards Deming, then working on statistical methods for the United States government, published a list of thirteen factors that affect the usefulness of a survey, including variation between interviewers, bias from nonresponse, errors in processing and the effects of the questions themselves (Deming, 1944). His point was that statisticians had become very good at calculating sampling error while ignoring other errors that were often larger.
Statisticians at the United States Census Bureau developed formal models of measurement error in censuses and surveys during the 1950s and 1960s, and Leslie Kish's textbook Survey Sampling distinguished clearly between variable errors and biases and between sampling and nonsampling sources (Kish, 1965). The phrase "total survey error" came into wide use after Robert Groves's book Survey Errors and Survey Costs (Groves, 1989), which brought the different traditions together and argued that every design decision is a trade-off between reducing some error and paying for it. Groves and Lyberg (2010) give a detailed history of how the concept developed from these roots.
Two ways a survey can go wrong
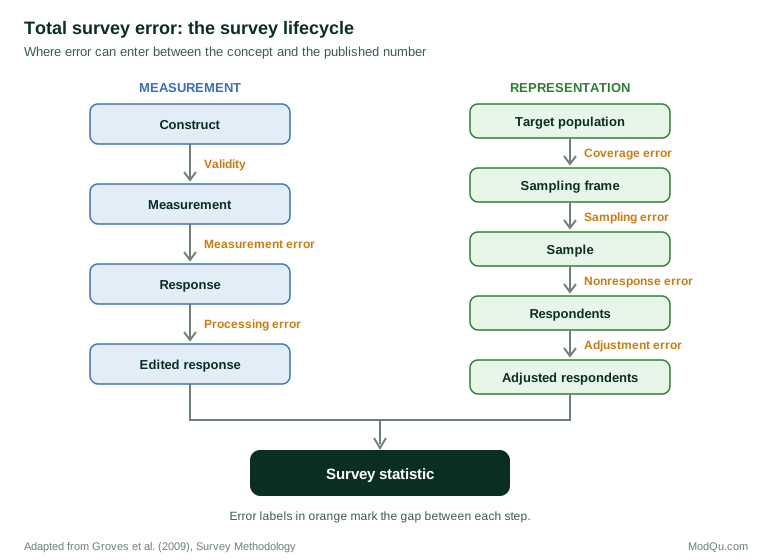
The most widely used version of the framework divides survey error into two branches that follow the life of a survey (Groves et al., 2009). One branch concerns measurement: how well the answers reflect the thing being studied. The other concerns representation: how well the people who provide answers reflect the population being studied.
The measurement branch
A survey starts with a construct, the idea the researcher wants to measure, such as customer loyalty or household income. The construct is turned into one or more questions. If the questions do not capture the construct well, the survey has a validity problem: it measures something, just not quite the intended thing. A question about "how often you shop with us" may capture habit and convenience rather than loyalty.
Next, people answer the questions. Their answers may differ from the true value because they misunderstand the question, cannot remember accurately, prefer to give a socially acceptable answer, or are influenced by the interviewer or the layout of a web page. These are measurement errors. A large body of research shows that answering a question involves understanding it, retrieving relevant memories, forming a judgement and fitting that judgement to the response options offered, and that each step can go wrong (Tourangeau et al., 2000). The mode of data collection matters too: people report sensitive behaviour more honestly when answering on a screen than when speaking to an interviewer (Kreuter et al., 2008).
Interviewers add a further source of measurement error. Each interviewer reads questions, probes and records answers in a slightly different way, and respondents react to interviewers' voices, ages and manner. Because each interviewer handles many cases, these small differences are correlated within each interviewer's workload. Kish (1962) showed that even modest interviewer effects can inflate the variance of estimates substantially, in the same way that clustering a sample does, so that a survey with a few interviewers each handling many cases is less precise than its sample size suggests.
Finally, answers are checked, coded and edited. Mistakes in coding open-ended answers, in data entry or in automated cleaning rules produce processing error.
The representation branch
The representation branch begins with the target population, the group the survey is meant to describe, such as all small businesses in Canada or all adults who bought a car in the last year. Researchers rarely have a perfect list of that population. The list or method they actually use to reach people is the sampling frame. People who are in the population but not on the frame, or who cannot be reached by the chosen method, create coverage error. A survey of customers drawn from an email list misses customers whose addresses are out of date.
From the frame a sample is drawn. Because a sample is only part of the population, its results vary by chance from one sample to another. This is sampling error, the only error the margin of error measures (Lohr, 2021). Some selected people do not respond. If those who respond differ from those who do not on the topics measured, the result is nonresponse error (Groves, 2006). Last, researchers usually weight the respondents to match known population totals. Weighting can reduce coverage and nonresponse error, but if the weighting variables are poorly chosen it can leave bias in place or add variance, which the framework calls adjustment error.
Bias and variance
Each error source can have two components. Variable errors change from one replication of the survey to another and average out over many replications; sampling error is the classic example, but interviewers and coders also contribute variable error. Biases push results in the same direction every time the survey is repeated; a frame that systematically omits younger people biases every estimate related to age.
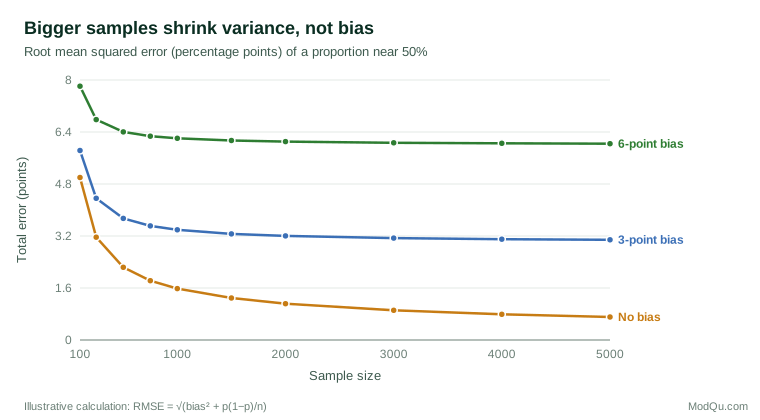
The framework combines these components into a single measure, the mean squared error (MSE) of an estimate:
MSE = bias² + variance
The formula has an important consequence. Increasing the sample size reduces the variance but does nothing to the bias. Once a sample is large, further increases in size buy very little accuracy, while the bias remains untouched (Biemer, 2010). The 1936 Literary Digest poll, with more than two million returns and a forecast nearly twenty points wrong, is the textbook example.
How large are the errors that are not reported?
Because most nonsampling errors are hard to measure, they are easy to overlook. Election polls provide one of the few settings in which survey estimates can be compared with a known true value. Shirani-Mehr et al. (2018) analysed 4,221 polls for 608 United States state-level presidential, Senate and governor elections between 1998 and 2014. The average error was about 3.5 percentage points, roughly twice as large as most reported margins of error implied. The extra error came from sources the margin of error ignores, including frame problems, nonresponse and uncertainty about who would vote. A review of the 2016 United States presidential polls reached a similar conclusion: the misses in several states were largely explained by late changes in voter preference and by a failure to weight for education, a variable linked to both response and vote choice (Kennedy et al., 2018).
Nonresponse bias has been studied directly. A meta-analysis of studies that had information on both respondents and nonrespondents found that the response rate on its own was a weak predictor of bias; bias depended mainly on whether the reasons for responding were related to the variables being measured (Groves & Peytcheva, 2008). In other words, a survey with a modest response rate can be accurate, and one with a high response rate can be biased, which is exactly the kind of insight the framework is designed to bring out.
Errors, costs and other dimensions of quality
Groves (1989) stressed that error cannot be discussed apart from cost. Every survey has a budget, and money spent on one source of error is not available for another. A larger sample reduces sampling error; the same money could instead pay for more reminders to reduce nonresponse, for pretesting to reduce measurement error, or for a better frame to reduce coverage error. The framework encourages designers to put resources where the largest errors are likely to be, not where they are easiest to measure. Responsive and adaptive designs extend this idea by monitoring error indicators during fieldwork and shifting effort as the data come in (Groves & Heeringa, 2006).
Accuracy is also only one aspect of quality. Statistical agencies and survey methodologists describe quality as fitness for use, which includes relevance, timeliness, accessibility, interpretability and coherence as well as accuracy (Biemer & Lyberg, 2003). A perfectly accurate survey that arrives six months after a decision has been made has little value. Biemer (2010) argues that the TSE framework is most useful when it is applied within this wider view, so that accuracy is maximised subject to the time and money available and the needs of the people who will use the results.
Criticisms and extensions
The framework has limitations, and its own developers have pointed them out. Groves and Lyberg (2010) note that most of the error components are rarely measured in practice, so the framework is better at organising thinking than at producing a single total error figure. They also note that it pays relatively little attention to the user's perspective and to the interactions between error sources, such as the way efforts to persuade reluctant respondents can bring in people who answer less carefully.
Others have extended the model. Smith (2011) proposed adding comparison error for surveys that compare countries, languages or time periods, where differences in translation or administration can create apparent differences that do not exist. Weisberg (2005) organised the field around the same set of errors, together with the constraints of cost, time and ethics, and treated the framework as the basis of a "new science" of survey research.
The growth of digital data has prompted a further extension. Administrative records, transactions, sensor readings and social media posts are increasingly used alongside or instead of surveys. These sources have their own versions of coverage error (who uses the platform), measurement error (what a click or a post actually means) and processing error (how the data are cleaned and linked). An American Association for Public Opinion Research task force argued that the logic of total error should be applied to such data rather than abandoned (Japec et al., 2015), and Amaya et al. (2020) set out a "total error" framework adapted for big data. Groves (2011) described the current period as one in which designed survey data and "organic" digital data must be combined, and the framework provides a shared language for judging both.
Using the framework in practice
For anyone who commissions or reads survey research, the framework turns into a short set of questions that can be asked of any study:
- Construct and questions. Do the questions measure the concept that matters for the decision? Were they pretested?
- Population and frame. Who is the survey meant to describe, and who could not have been included?
- Sample. How were respondents selected? If not by a probability method, what assumptions replace the usual margin of error?
- Response. Who responded and who did not? Is there any evidence about whether nonrespondents differ?
- Processing and adjustment. How were the data cleaned, coded and weighted, and to what population totals?
- Reported uncertainty. Does the stated margin of error cover anything other than sampling error?
Survey organisations can use the same list internally. Biemer et al. (2017) collect case studies in which the framework was used to decide where to spend a fixed budget: in one study the largest error came from the frame, in another from interviewers, in a third from the way an open question was coded. The common lesson is that the dominant error differs from survey to survey, so it has to be looked for rather than assumed. A practical routine is to rate each step of the lifecycle as a low, medium or high risk for the survey at hand, gather whatever evidence is available on the high-risk steps, and report those risks honestly alongside the results.
These questions do not require technical training to ask, but the answers reveal a great deal about how much confidence a set of results deserves. Brick (2011) argues that the future of survey sampling depends on being explicit about these sources of error, especially as researchers rely more on samples that are not drawn by probability methods.
Conclusion
The total survey error framework replaces a narrow question, "how big is the sample?", with a broader one: "at which points could this number have gone wrong, and by how much?" It shows that sampling error is often not the largest source of inaccuracy, that bias does not shrink as samples grow, and that improving quality means spending money where the largest errors are. For a research company, the framework is also a commitment to transparency. Describing how a survey was designed at each step of the lifecycle allows the people who use its results to judge their quality for themselves.
References
Amaya, A., Biemer, P. P., & Kinyon, D. (2020). Total error in a big data world: Adapting the TSE framework to big data. Journal of Survey Statistics and Methodology, 8(1), 89–119. https://doi.org/10.1093/jssam/smz056
Biemer, P. P., & Lyberg, L. E. (2003). Introduction to survey quality. Wiley. https://doi.org/10.1002/0471458740
Biemer, P. P. (2010). Total survey error: Design, implementation, and evaluation. Public Opinion Quarterly, 74(5), 817–848. https://doi.org/10.1093/poq/nfq058
Biemer, P. P., de Leeuw, E., Eckman, S., Edwards, B., Kreuter, F., Lyberg, L. E., Tucker, N. C., & West, B. T. (Eds.). (2017). Total survey error in practice. Wiley. https://doi.org/10.1002/9781119041702
Brick, J. M. (2011). The future of survey sampling. Public Opinion Quarterly, 75(5), 872–888. https://doi.org/10.1093/poq/nfr045
Deming, W. E. (1944). On errors in surveys. American Sociological Review, 9(4), 359–369. https://doi.org/10.2307/2085979
Groves, R. M., & Heeringa, S. G. (2006). Responsive design for household surveys: Tools for actively controlling survey errors and costs. Journal of the Royal Statistical Society: Series A, 169(3), 439–457. https://doi.org/10.1111/j.1467-985X.2006.00423.x
Groves, R. M., & Lyberg, L. (2010). Total survey error: Past, present, and future. Public Opinion Quarterly, 74(5), 849–879. https://doi.org/10.1093/poq/nfq065
Groves, R. M., & Peytcheva, E. (2008). The impact of nonresponse rates on nonresponse bias: A meta-analysis. Public Opinion Quarterly, 72(2), 167–189. https://doi.org/10.1093/poq/nfn011
Groves, R. M. (1989). Survey errors and survey costs. Wiley. https://doi.org/10.1002/0471725277
Groves, R. M. (2006). Nonresponse rates and nonresponse bias in household surveys. Public Opinion Quarterly, 70(5), 646–675. https://doi.org/10.1093/poq/nfl033
Groves, R. M. (2011). Three eras of survey research. Public Opinion Quarterly, 75(5), 861–871. https://doi.org/10.1093/poq/nfr057
Groves, R. M., Fowler, F. J., Jr., Couper, M. P., Lepkowski, J. M., Singer, E., & Tourangeau, R. (2009). Survey methodology (2nd ed.). Wiley.
Japec, L., Kreuter, F., Berg, M., Biemer, P., Decker, P., Lampe, C., Lane, J., O'Neil, C., & Usher, A. (2015). Big data in survey research: AAPOR task force report. Public Opinion Quarterly, 79(4), 839–880. https://doi.org/10.1093/poq/nfv039
Kennedy, C., Blumenthal, M., Clement, S., Clinton, J. D., Durand, C., Franklin, C., McGeeney, K., Miringoff, L., Olson, K., Rivers, D., Saad, L., Witt, G. E., & Wlezien, C. (2018). An evaluation of the 2016 election polls in the United States. Public Opinion Quarterly, 82(1), 1–33. https://doi.org/10.1093/poq/nfx047
Kish, L. (1962). Studies of interviewer variance for attitudinal variables. Journal of the American Statistical Association, 57(297), 92–115. https://doi.org/10.1080/01621459.1962.10482153
Kish, L. (1965). Survey sampling. Wiley.
Kreuter, F., Presser, S., & Tourangeau, R. (2008). Social desirability bias in CATI, IVR, and web surveys: The effects of mode and question sensitivity. Public Opinion Quarterly, 72(5), 847–865. https://doi.org/10.1093/poq/nfn063
Lohr, S. L. (2021). Sampling: Design and analysis (3rd ed.). CRC Press. https://doi.org/10.1201/9780429298899
Shirani-Mehr, H., Rothschild, D., Goel, S., & Gelman, A. (2018). Disentangling bias and variance in election polls. Journal of the American Statistical Association, 113(522), 607–614. https://doi.org/10.1080/01621459.2018.1448823
Smith, T. W. (2011). Refining the total survey error perspective. International Journal of Public Opinion Research, 23(4), 464–484. https://doi.org/10.1093/ijpor/edq052
Tourangeau, R., Rips, L. J., & Rasinski, K. (2000). The psychology of survey response. Cambridge University Press. https://doi.org/10.1017/CBO9780511819322
Weisberg, H. F. (2005). The total survey error approach: A guide to the new science of survey research. University of Chicago Press. https://doi.org/10.7208/9780226891293