
Surveys · Foundations and history
Census Versus Sample Survey: When Counting Everyone Is Worth the Cost
A census counts everyone; a sample survey asks a few. This article explains what each approach does well, why a well-run sample can be more accurate than a full count, and how to decide which one a research question needs.
There are two basic ways to learn about a population. One is to collect information from every member, which is a census. The other is to collect it from a selected part and use the results to estimate figures for the whole, which is a sample survey. The choice seems obvious at first: counting everyone must be more accurate than counting some. In practice the answer is less simple. Censuses are expensive, slow and prone to their own errors, and a carefully run sample can produce more accurate results for many purposes. This article explains the trade-offs and offers a practical way to decide.
What a census does that a sample cannot
The great strength of a census is detail at small scale. Because every household is included, a census can produce reliable figures for every neighbourhood, small town and small population group. A national sample of 10,000 households might estimate a country's unemployment rate within a fraction of a percentage point, yet contain only a handful of households in any given postal district. National population censuses exist largely to provide this local detail, together with official population counts used to allocate political representation and public funding (Baffour et al., 2013).
A census has a second, less visible role: it provides the foundation for sample surveys. Census counts are used to design samples, to define strata and to weight survey results so that they match the population. In this sense, sample surveys depend on censuses rather than competing with them (Kish, 1979).
Finally, a census has no sampling error. When everyone is counted, there is no chance variation from selecting one sample rather than another. The arithmetic of sampling also favours a census when the population is small. The precision of a sample depends mainly on the number of people in it, not on the share of the population it covers, so a survey needs roughly the same number of responses to describe a town of 50,000 as a country of 50 million. Only when the sample becomes a large fraction of the population does the "finite population correction" reduce the error appreciably (Bethlehem, 2009). For a small population, such as the 40 branch managers in a company or the 300 members of a professional association, contacting everyone is often simpler than drawing a sample, and it removes any argument about whether the selected people were typical.
What a sample does that a census cannot
Cost and speed
A sample survey costs a fraction of a census. Fewer interviews mean fewer interviewers, less processing and faster results. Monthly labour force surveys, which produce official unemployment figures in Canada, the United States and many other countries, would be impossible as monthly censuses.
Depth
Because each interview is cheaper in aggregate, a sample survey can ask many more questions and ask them in more detail. Censuses usually limit themselves to a short list of basic items. Detailed questions on income, health, employment history or attitudes are typically left to sample surveys or to a longer questionnaire given only to a sample of census households. The idea of combining a short count of everyone with a longer questionnaire for a sample goes back to the early arguments for the representative method, which showed that a properly randomised part of a population could stand in for the whole (Neyman, 1934). The United States took the idea further after the 2000 census by replacing its census long form with the American Community Survey, a continuous monthly sample that produces detailed estimates every year rather than once a decade, at the cost of larger sampling errors for small areas (Citro & Kalton, 2007).
Accuracy
The most counter-intuitive advantage is accuracy. Total error has two parts: sampling error, which a census avoids, and nonsampling error, which affects both approaches. Nonsampling errors include missed people, refusals, misunderstood questions, interviewer mistakes and processing errors. A census must hire and train a very large temporary workforce quickly and process millions of forms, which makes these errors hard to control. A sample survey can use fewer, better trained and better supervised interviewers, follow up nonrespondents intensively and check its work more carefully. Statisticians have long argued that for many purposes the reduction in nonsampling error more than offsets the sampling error introduced (Deming, 1950; Cochran, 1977). Lohr (2021) gives several examples in which samples were used precisely because they could be done better than a full count.
Censuses have errors too
Censuses are not perfect counts. Every major census misses some people and counts others twice, and the errors are not evenly distributed. Statistical agencies measure census coverage using a post-enumeration survey, an independent high-quality sample survey carried out after the census, whose results are matched to census records to estimate how many people were missed or duplicated (Hogan, 1993).
These evaluations show a consistent pattern. People who move often, rent rather than own, live in complex households or belong to some minority groups are more likely to be missed. The United States Census Bureau's evaluation of the 2020 census estimated that the net national count was close to accurate, but that the Black population was undercounted by about 3.3%, the Hispanic population by about 5.0% and the American Indian population living on reservations by about 5.6%, while the non-Hispanic White and Asian populations were overcounted by about 1.6% and 2.6% respectively (U.S. Census Bureau, 2022). Anderson and Fienberg (1999) describe the long political and statistical debate in the United States over whether such sample-based estimates should be used to adjust census counts.
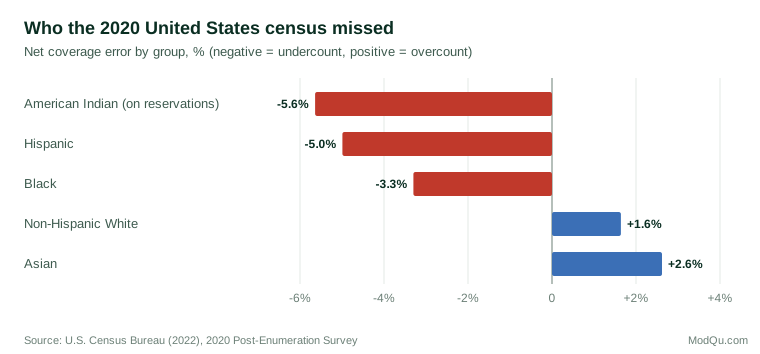
The lesson is that a census answer is itself an estimate, and its accuracy has to be checked with a sample.
A Canadian case: mandatory versus voluntary
Canada provides a well-known natural experiment in the value of a high-quality count. Until 2006, one household in five received a mandatory long-form census questionnaire with detailed questions on income, education, ethnicity, housing and work. For 2011 the federal government replaced the mandatory long form with the voluntary National Household Survey. The survey was sent to a larger share of households to compensate, but its unweighted response rate was 68.6%, well below that of the mandatory long form it replaced (Statistics Canada, 2013). Because nonresponse was concentrated among particular groups and places, Statistics Canada withheld or flagged results for many small communities, and researchers warned that comparisons over time had become unreliable (Green & Milligan, 2010). The mandatory long form was restored for 2016, sent to one household in four, and its final response rate was 96.9% (Statistics Canada, 2017).
The episode shows that the useful distinction is not simply "everyone versus a sample." The long form was itself a large sample. What mattered was whether the selected households were required, and therefore highly likely, to respond. A large sample with low and uneven response can be less informative than a smaller one with high response.
New models of the census
Several countries are changing what a census is. Nordic countries and the Netherlands now produce census statistics largely from linked administrative registers of population, housing and employment, supplemented by sample surveys for items the registers do not cover. Other countries use a "rolling" census in which a different fraction of the population is enumerated each year, so that full coverage is built up over a cycle of years (Baffour et al., 2013). These designs blur the line between census and survey, combining complete administrative counts with samples for depth.
How to choose
For organisations designing their own research, the choice between contacting everyone and drawing a sample depends on a few practical questions.
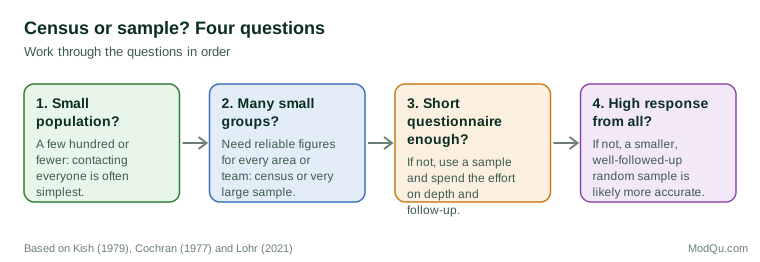
- How large is the population? For a few hundred people or fewer, a census is often simplest, and the sample needed for useful precision would cover most of the population anyway.
- Are results needed for small groups? If every store, team or region needs its own reliable figure, the number of responses per group drives the design, and that may require contacting everyone.
- How much detail is needed? If the questions are many or complex, it is usually better to spend the budget on a sample with careful questionnaire design and follow-up than on a thin census.
- Can high response be achieved? A census with 30% response is in effect a self-selected sample of 30%, with all the risks of self-selection. A random sample with 70% response may well be more accurate.
The last point is the one most often overlooked. Many organisational "censuses", such as employee surveys sent to all staff, are really self-selected samples. Treating them as complete counts because everyone was invited ignores the fact that the people who did not answer may differ from those who did (Groves et al., 2009). Research on nonresponse shows that the risk depends less on the response rate itself than on whether the reasons for answering are linked to the topic of the survey (Groves & Peytcheva, 2008). Staff who are unhappy with their manager may be either more or less likely to complete an engagement survey, and in either case the "census" result will be biased.
Conclusion
A census is worth its cost when small-area detail, official counts or a sampling frame for future surveys are needed, and when the population is small enough or the obligation to respond strong enough to make near-complete coverage realistic. For most other purposes, a well-designed sample survey is cheaper, faster, richer in detail and often more accurate. In both cases, what determines the quality of the result is not the number of people invited but how completely and accurately the intended people are reached and measured.
References
Anderson, M. J., & Fienberg, S. E. (1999). Who counts? The politics of census-taking in contemporary America. Russell Sage Foundation.
Baffour, B., King, T., & Valente, P. (2013). The modern census: Evolution, examples and evaluation. International Statistical Review, 81(3), 407–425. https://doi.org/10.1111/insr.12036
Bethlehem, J. (2009). Applied survey methods: A statistical perspective. Wiley. https://doi.org/10.1002/9780470494998
Citro, C. F., & Kalton, G. (Eds.). (2007). Using the American Community Survey: Benefits and challenges. National Academies Press. https://doi.org/10.17226/11901
Cochran, W. G. (1977). Sampling techniques (3rd ed.). Wiley.
Deming, W. E. (1950). Some theory of sampling. Wiley.
Green, D. A., & Milligan, K. (2010). The importance of the long form census to Canada. Canadian Public Policy, 36(3), 383–388. https://doi.org/10.3138/cpp.36.3.383
Groves, R. M., & Peytcheva, E. (2008). The impact of nonresponse rates on nonresponse bias: A meta-analysis. Public Opinion Quarterly, 72(2), 167–189. https://doi.org/10.1093/poq/nfn011
Groves, R. M., Fowler, F. J., Jr., Couper, M. P., Lepkowski, J. M., Singer, E., & Tourangeau, R. (2009). Survey methodology (2nd ed.). Wiley.
Hogan, H. (1993). The 1990 post-enumeration survey: Operations and results. Journal of the American Statistical Association, 88(423), 1047–1060. https://doi.org/10.1080/01621459.1993.10476374
Kish, L. (1979). Samples and censuses. International Statistical Review, 47(2), 99–109. https://doi.org/10.2307/1402563
Lohr, S. L. (2021). Sampling: Design and analysis (3rd ed.). CRC Press. https://doi.org/10.1201/9780429298899
Neyman, J. (1934). On the two different aspects of the representative method: The method of stratified sampling and the method of purposive selection. Journal of the Royal Statistical Society, 97(4), 558–625. https://doi.org/10.2307/2342192
Statistics Canada. (2013). Final response rates, National Household Survey 2011. https://www12.statcan.gc.ca/nhs-enm/2011/ref/about-apropos/nhs-enm_r012.cfm?Lang=E
Statistics Canada. (2017). Guide to the Census of Population, 2016 (Catalogue no. 98-304-X). https://www12.statcan.gc.ca/census-recensement/2016/ref/98-304/index-eng.cfm
U.S. Census Bureau. (2022, March 10). Census Bureau releases estimates of undercount and overcount in the 2020 census [Press release]. https://www.census.gov/newsroom/press-releases/2022/2020-census-estimates-of-undercount-and-overcount.html