
Surveys · Foundations and history
Descriptive, Analytical and Experimental Surveys Compared
Surveys are used to describe populations, to explain differences within them and to test what causes what. Each purpose calls for different design choices, and confusing them is a common source of misleading conclusions.
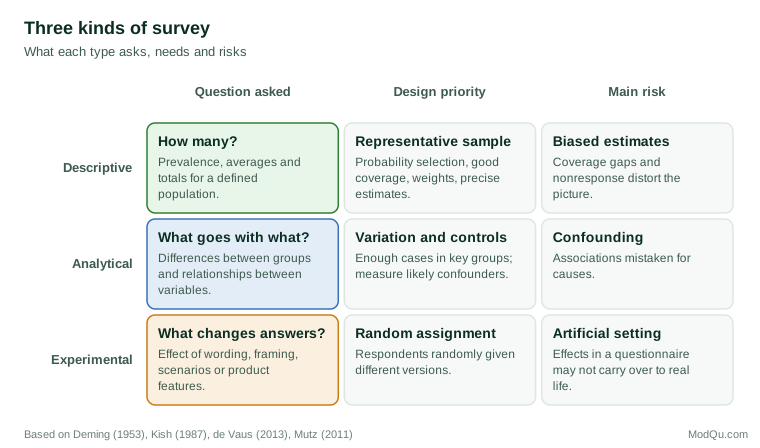
Not all surveys are trying to do the same thing. Some aim to measure how common a characteristic is in a population. Others aim to explain why some people differ from others. A third group uses the survey as a vehicle for a controlled experiment. Methodologists describe these as descriptive, analytical and experimental surveys (de Vaus, 2013). The three types can share a questionnaire and even a sample, but they answer different kinds of questions, and each puts different demands on design. Knowing which kind of survey you are running, or reading, is the first step in judging whether its conclusions are sound.
Descriptive surveys
A descriptive survey answers the question "how many?" or "how much?" It estimates the proportion of customers who are satisfied, the average household income in a region, or the share of small businesses planning to hire. Official labour force and household surveys are mostly descriptive, as are many market sizing and customer tracking studies.
W. Edwards Deming called these enumerative studies, because their aim is to describe a fixed, defined population as it is (Deming, 1953). The key quality for a descriptive survey is representativeness. The sample must be selected so that its results can be projected to the population with known precision, which is why probability sampling, careful coverage and weighting matter so much (Lohr, 2021). The questions must also define clearly what is being counted, since a vague question produces a precise estimate of an unclear quantity.
Descriptive surveys are often repeated at intervals with the same questions, so that change over time can be tracked. The value of such a series depends on keeping the design stable: the same population definition, similar sampling and mode, and identical wording. When any of these changes, part of the apparent trend may be an artefact of the change in method rather than a real shift in the population.
The main limitation of a descriptive survey is that it says nothing about causes. Knowing that 30% of customers are dissatisfied does not reveal why, or what would change it.
Analytical surveys
An analytical survey asks "why?" or "what goes with what?" It looks for relationships between variables: whether satisfaction differs by age, whether employees who receive more training are more engaged, or whether households with children spend differently from those without. Analytical surveys compare groups and use statistical models to estimate how one characteristic is associated with another once other factors are taken into account. The early panel studies of voting behaviour, which followed the same people through an election campaign to see how their intentions formed and changed, are classic examples (Lazarsfeld et al., 1944).
Deming (1953) stressed that analytical studies have a different aim from enumerative ones: they seek to understand the causal system that produces the data, so that conclusions can be applied to future conditions, not only to the population surveyed. This changes the design priorities. An analytical survey needs enough variation in the factors of interest, enough cases in the groups being compared and measurement of the other factors that might explain any difference. A sample that is perfectly representative but contains too few people in a key group can be useless for analysis, while a sample that deliberately over-represents small groups can be very efficient for comparisons even though it needs weighting for description (Kish, 1987).
Analytical surveys also raise statistical questions that descriptive ones avoid. Complex samples with clustering, stratification and weighting affect the standard errors of regression coefficients as well as of simple percentages, and analysts must decide whether and how to use survey weights in models (Skinner et al., 1989). Kalton (1983) discussed the long debate between design-based reasoning, which relies on the way the sample was drawn, and model-based reasoning, which relies on assumptions about how the data were generated; analytical uses of surveys usually require some of both.
The central limitation of analytical surveys is causal inference. Associations in observational data can arise because one factor causes another, because both are caused by a third, or because the direction of influence runs the other way. Holland (1986) set out why, without random assignment, the causal effect of a factor cannot be estimated from associations alone except under strong assumptions. Panel designs, careful control variables and comparisons of the same people over time all help, but they do not remove the problem entirely.
Experimental surveys
An experimental survey adds random assignment. Respondents are randomly divided into groups that receive different versions of a question, scenario, message or product description, and the answers of the groups are compared. Because assignment is random, any systematic difference in answers can be attributed to the difference in what the groups saw.
The earliest survey experiments were split-ballot studies of question wording. Schuman and Presser (1981) used dozens of them to show how wording, order and response format affect answers. One of the best-known findings is that Americans express much more support for spending on "assistance to the poor" than for spending on "welfare", even though the two refer to largely the same programmes (Smith, 1987; Rasinski, 1989). Tversky and Kahneman (1981) used similar between-group designs to show that people choose differently when the same outcomes are framed as gains or as losses.
Survey experiments now take many forms (Mutz, 2011):
- Wording and framing experiments, which test how the way an issue is described changes opinions.
- Vignette or factorial experiments, in which respondents rate short scenarios whose features are varied at random, so that the effect of each feature on judgements can be estimated (Auspurg & Hinz, 2015).
- Conjoint experiments, in which respondents choose between profiles of products, candidates or policies with randomly varied attributes, revealing which attributes drive choices (Hainmueller et al., 2014).
- List experiments, which estimate how many people hold a sensitive view or have done a sensitive thing without any individual revealing their own answer (Glynn, 2013).
The strength of experimental surveys is internal validity: when the experiment is properly randomised, the comparison between groups is a fair test. Running the experiment on a representative population sample, rather than on students or volunteers, adds external validity, which is the main advantage Mutz (2011) identifies for population-based survey experiments. Evidence suggests that many experimental effects found with convenience samples are reproduced in population samples, but not all of them (Mullinix et al., 2015).
Experimental surveys have their own limits. The treatment is usually a few lines of text or an image, which may be weaker or stronger than the real-world experience it represents. Respondents answering a hypothetical question are not making a real decision. Gaines et al. (2007) warned that survey experiments can overstate effects that would fade quickly outside the questionnaire, or that respondents had already encountered before the survey.
Combining the three
Many studies combine all three types. A customer survey might estimate the share of customers who are satisfied (descriptive), compare satisfaction across segments and service experiences (analytical) and randomly assign respondents to different descriptions of a proposed new feature to test which is most appealing (experimental). The combination is powerful, but each part should be designed for its purpose:
- Descriptive estimates need a representative sample, weights and honest margins of error.
- Analytical comparisons need adequate numbers in each group and measurement of likely confounders, and their causal interpretation should be cautious.
- Experimental comparisons need genuine random assignment within the sample, enough respondents per version and a treatment realistic enough to matter.
How purpose changes the numbers
The difference between the three types becomes concrete when sample sizes are planned. Take a survey of 1,000 randomly selected customers.
For a descriptive estimate of the share of all customers who are satisfied, 1,000 responses give a margin of error of about ±3 percentage points at the usual 95% level of confidence, which is adequate for most business decisions (Lohr, 2021).
For an analytical comparison between two segments, the arithmetic changes. If only 200 respondents fall into each of the two segments being compared, the margin of error on the difference between them is about ±10 points. A real gap of five points between the segments would be indistinguishable from chance. If the comparison is central to the study, the design should over-sample the segments so that each has enough cases, and then weight back for the overall estimate (Kish, 1987).
For an experimental test of four alternative product descriptions, the 1,000 respondents are split into four randomly assigned groups of about 250. The margin of error on the difference between any two versions is about ±9 points, so only large effects will be detected reliably. Testing two versions rather than four, or increasing the sample, makes smaller effects visible.
The same 1,000 interviews can therefore be generous for one purpose and inadequate for another. Planning the sample around the most demanding comparison, rather than around the headline estimate, avoids the common disappointment of a survey that describes the market well but cannot answer the questions about differences that prompted it.
Avoiding mix-ups
A common mistake is to present analytical results as if they were experimental: to report that customers who used a feature are more satisfied and conclude that the feature causes satisfaction. Another is to treat experimental results from an unrepresentative sample as if they described the population. Clear labelling of which type of inference each finding supports helps readers avoid both errors. In a report, this can be as simple as stating beside each finding whether it is an estimate for the population, an association between characteristics, or the result of a randomised comparison, and what that implies for how far it can be relied on.
Conclusion
Descriptive surveys tell us what a population looks like, analytical surveys suggest why it looks that way, and experimental surveys test what changes people's responses. Each answers a different question and demands a different design. Good survey research is explicit about which question it is trying to answer, chooses the design that suits it, and reports its findings with the kind of confidence that design can support.
References
Auspurg, K., & Hinz, T. (2015). Factorial survey experiments. SAGE. https://doi.org/10.4135/9781483398075
de Vaus, D. (2013). Surveys in social research (6th ed.). Routledge. https://doi.org/10.4324/9780203519196
Deming, W. E. (1953). On the distinction between enumerative and analytic surveys. Journal of the American Statistical Association, 48(262), 244–255. https://doi.org/10.1080/01621459.1953.10483470
Gaines, B. J., Kuklinski, J. H., & Quirk, P. J. (2007). The logic of the survey experiment reexamined. Political Analysis, 15(1), 1–20. https://doi.org/10.1093/pan/mpl008
Glynn, A. N. (2013). What can we learn with statistical truth serum? Design and analysis of the list experiment. Public Opinion Quarterly, 77(S1), 159–172. https://doi.org/10.1093/poq/nfs070
Hainmueller, J., Hopkins, D. J., & Yamamoto, T. (2014). Causal inference in conjoint analysis: Understanding multidimensional choices via stated preference experiments. Political Analysis, 22(1), 1–30. https://doi.org/10.1093/pan/mpt024
Holland, P. W. (1986). Statistics and causal inference. Journal of the American Statistical Association, 81(396), 945–960. https://doi.org/10.1080/01621459.1986.10478354
Kalton, G. (1983). Models in the practice of survey sampling. International Statistical Review, 51(2), 175–188. https://doi.org/10.2307/1402747
Kish, L. (1987). Statistical design for research. Wiley. https://doi.org/10.1002/0471725196
Lazarsfeld, P. F., Berelson, B., & Gaudet, H. (1944). The people's choice: How the voter makes up his mind in a presidential campaign. Duell, Sloan and Pearce.
Lohr, S. L. (2021). Sampling: Design and analysis (3rd ed.). CRC Press. https://doi.org/10.1201/9780429298899
Mullinix, K. J., Leeper, T. J., Druckman, J. N., & Freese, J. (2015). The generalizability of survey experiments. Journal of Experimental Political Science, 2(2), 109–138. https://doi.org/10.1017/XPS.2015.19
Mutz, D. C. (2011). Population-based survey experiments. Princeton University Press.
Rasinski, K. A. (1989). The effect of question wording on public support for government spending. Public Opinion Quarterly, 53(3), 388–394. https://doi.org/10.1086/269158
Schuman, H., & Presser, S. (1981). Questions and answers in attitude surveys: Experiments on question form, wording, and context. Academic Press.
Skinner, C. J., Holt, D., & Smith, T. M. F. (Eds.). (1989). Analysis of complex surveys. Wiley.
Smith, T. W. (1987). That which we call welfare by any other name would smell sweeter: An analysis of the impact of question wording on response patterns. Public Opinion Quarterly, 51(1), 75–83. https://doi.org/10.1086/269015
Tversky, A., & Kahneman, D. (1981). The framing of decisions and the psychology of choice. Science, 211(4481), 453–458. https://doi.org/10.1126/science.7455683