
Surveys · Types and applications
Political and Public Opinion Polling: Methods and Accuracy
Election polls are the most visible surveys in public life. This article explains how political polls are conducted, why their real error is larger than the reported margin of error, why some elections have been called wrongly and how to read polls sensibly.
Political polls are the surveys most people see. They measure support for parties and candidates, approval of leaders and opinion on issues, and they shape how campaigns, journalists and voters understand an election. Because the final result is eventually known, election polls are also one of the few kinds of survey whose accuracy can be checked directly.
Types of political polls
Political polls take several forms. Voting intention polls ask which party or candidate people would vote for if an election were held now. Approval ratings track how the public judges a leader or government over time. Issue polls measure opinion on policies such as taxation, immigration or health care. Tracking polls interview a fresh sample every day and report a rolling average over several days, which shows how opinion moves during a campaign. Parties and candidates also commission private polls to test messages and identify persuadable voters; these are rarely published.
How polls are conducted
A poll interviews a sample of adults, usually between 1,000 and 2,000, by telephone, online or by a mixture of methods. Answers are weighted so that the sample matches the population on characteristics such as age, sex, region, education and often past vote. Election polls also have to decide who will actually vote. A likely voter model uses questions about interest, past voting and intention to vote to identify, or give more weight to, the people most likely to turn out. Small differences in these choices can move a poll's estimate by several points.
Error beyond the margin
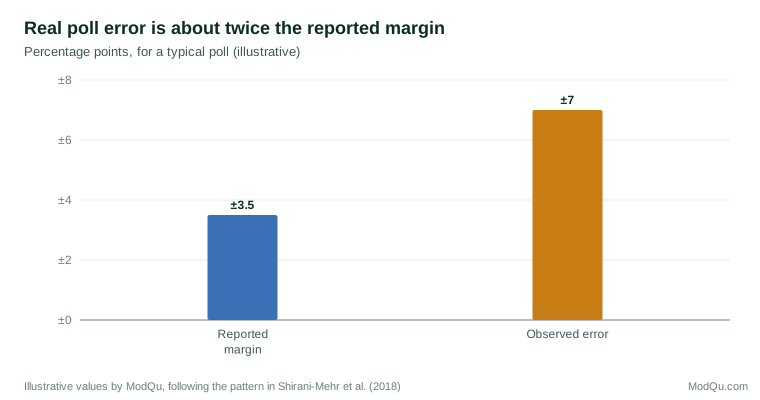
Polls usually report a margin of error, often about three percentage points for a sample of 1,000. This figure reflects only sampling error and assumes a random sample. In practice, polls also contain errors from nonresponse, weighting, likely voter models and late changes of mind. Shirani-Mehr et al. (2018) analysed thousands of state-level polls in the United States and found that their total error was about twice as large as the reported margin of error suggested, as Figure 1 illustrates.
When polls miss
High-profile misses, such as the 2015 general election in the United Kingdom and the 2016 presidential election in the United States, led to formal inquiries. In the UK, the inquiry found that the main cause was unrepresentative samples: the polls reached too many politically engaged people and too few of those who supported the winning party (Sturgis et al., 2018). In the United States, national polls were fairly accurate, but many state polls underestimated support for the winner, partly because they did not weight by education, at a time when education strongly predicted vote choice (Kennedy et al., 2018).
Yet the long-run record is better than these cases suggest. Jennings and Wlezien (2018) analysed over 30,000 polls from 45 countries since 1942 and found no evidence that polls have become less accurate over time. Polls taken months before an election predict the result less well than those taken just before it, because many voters decide late (Erikson & Wlezien, 2012).
Reading polls sensibly
- Look at averages of several polls rather than a single one.
- Allow for more error than the reported margin suggests.
- Check the method: who was sampled, how and when.
- Watch the trend in the same poll over time.
- Be cautious with subgroups, which have much larger errors.
New methods, such as statistical modelling of large online samples, have also produced accurate estimates when carefully adjusted (Wang et al., 2015).
An example
Two polls published on the same day show a party at 38 and 42 per cent. Each reports a margin of error of three points, so the difference looks surprising. But the polls used different modes, weighted by different variables and applied different likely voter models. An average of all polls published that week puts the party at 40 per cent, which is a better guide than either poll alone (illustrative example).
Conclusion
Political polls are generally accurate to within a few points, but their real error is larger than the margin of error suggests. Understanding how polls are made helps readers judge what a poll can and cannot tell them.
References
Erikson, R. S., & Wlezien, C. (2012). The timeline of presidential elections: How campaigns do (and do not) matter. University of Chicago Press. https://doi.org/10.7208/chicago/9780226922164.001.0001
Jennings, W., & Wlezien, C. (2018). Election polling errors across time and space. Nature Human Behaviour, 2(4), 276–283. https://doi.org/10.1038/s41562-018-0315-6
Kennedy, C., Blumenthal, M., Clement, S., Clinton, J. D., Durand, C., Franklin, C., McGeeney, K., Miringoff, L., Olson, K., Rivers, D., Saad, L., Witt, G. E., & Wlezien, C. (2018). An evaluation of the 2016 election polls in the United States. Public Opinion Quarterly, 82(1), 1–33. https://doi.org/10.1093/poq/nfx047
Shirani-Mehr, H., Rothschild, D., Goel, S., & Gelman, A. (2018). Disentangling bias and variance in election polls. Journal of the American Statistical Association, 113(522), 607–614. https://doi.org/10.1080/01621459.2018.1448823
Sturgis, P., Kuha, J., Baker, N., Callegaro, M., Fisher, S., Green, J., Jennings, W., Lauderdale, B. E., & Smith, P. (2018). An assessment of the causes of the errors in the 2015 UK general election opinion polls. Journal of the Royal Statistical Society: Series A (Statistics in Society), 181(3), 757–781. https://doi.org/10.1111/rssa.12329
Wang, W., Rothschild, D., Goel, S., & Gelman, A. (2015). Forecasting elections with non-representative polls. International Journal of Forecasting, 31(3), 980–991. https://doi.org/10.1016/j.ijforecast.2014.06.001