
Surveys · Types and applications
Conjoint Analysis Surveys: Measuring Trade-offs in Consumer Choice
Conjoint analysis asks people to choose between products that differ in several features at once, and infers how much each feature matters. This article explains how conjoint studies are designed and analysed, what they reveal and where they can mislead.
Ask customers which features they want in a product and they will usually say they want all of them, at the lowest price. Real purchases involve trade-offs: a longer battery life may come with a higher price, and a well-known brand with fewer features. Conjoint analysis is a survey method that measures these trade-offs. Instead of asking respondents to rate each feature separately, it shows them complete products that differ in several features at once and asks them to choose or rank. From their choices, the analysis infers how much each feature, and each level of each feature, contributes to the product's appeal (Green & Srinivasan, 1990).
Origins
The method grew out of mathematical psychology. Luce and Tukey (1964) showed how the separate contributions of several factors could be measured from overall judgements of combinations of those factors, a theory they called conjoint measurement. Green and Rao (1971) brought the idea into marketing research, and by the late 1980s conjoint analysis had become one of the most widely used methods in commercial research, applied to thousands of products and services (Wittink & Cattin, 1989). Green et al. (2001) reviewed three decades of development, from early ranking tasks with cards to computer-based choice studies.
Attributes and levels
A conjoint study begins by defining the attributes of the product, such as brand, price, size and a key feature, and the levels of each attribute, such as three brands or four prices. The attributes should be the ones that matter in real purchase decisions, defined in words that customers understand. Too many attributes make the task tiring and encourage respondents to focus on just one or two; most studies use between four and eight. The range of levels also matters: an attribute with a wider range of levels tends to appear more important, so levels should cover the range customers would realistically see.
Choice-based conjoint
The most common form today is choice-based conjoint, also called a discrete choice experiment. Each respondent completes a series of choice tasks, typically between 8 and 15. In each task, they see three or four product profiles side by side and choose the one they would buy, often with an option to buy none of them. The method was developed by Louviere and Woodworth (1983) and draws on the economic theory of choice and the logit model of McFadden (1974). Because the task resembles real shopping, in which customers choose among competing products, it is generally considered more realistic than rating or ranking products (Louviere et al., 2000).
The combinations of levels shown in each task follow an experimental design. A full design containing every possible combination would usually be far too large, so researchers use a fraction of it, chosen so that each attribute's effect can be estimated efficiently. Efficient designs balance how often each level appears and avoid tasks where one option is obviously better than the others (Huber & Zwerina, 1996). Adaptive versions adjust later tasks according to earlier answers, gathering more information from each respondent (Toubia et al., 2003).
Analysis
The analysis estimates a part-worth utility for each level of each attribute: a number showing how much that level adds to or subtracts from a product's appeal. Early studies estimated part-worths for the sample as a whole. Modern studies usually use hierarchical Bayes estimation, which estimates part-worths for each respondent by combining that respondent's choices with information from the whole sample (Lenk et al., 1996; Allenby & Rossi, 1998). Individual estimates show how preferences differ between customers and allow customers to be grouped into segments with similar priorities.
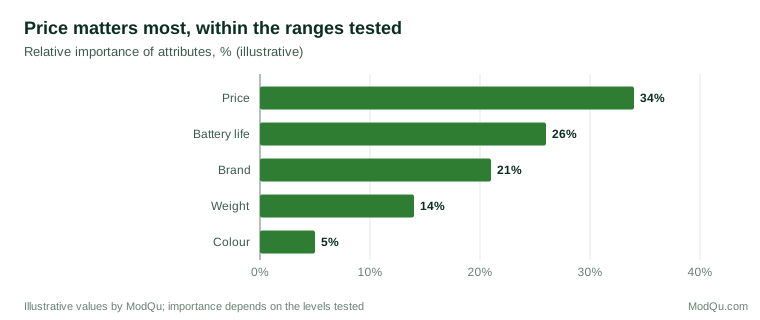
From the part-worths, researchers calculate the relative importance of each attribute: the range between its most and least preferred levels, as a share of the total across attributes. Figure 1 shows an example. Importance depends on the levels chosen and should be read as importance within the ranges tested, not in general.
Market simulation
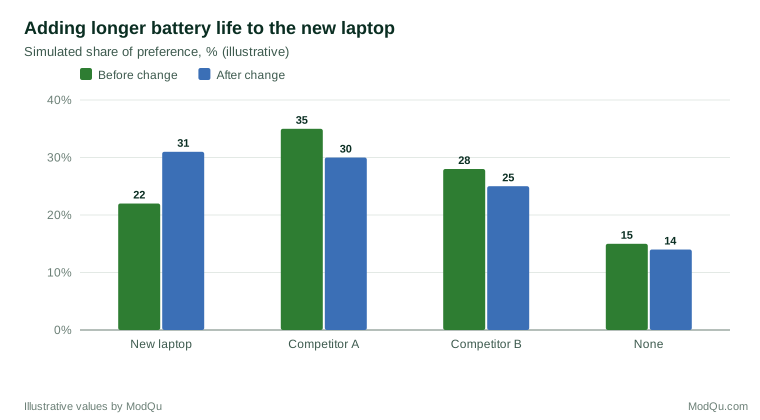
The most practical use of conjoint results is the market simulator. Researchers define a set of products that might compete in the market, including their own proposed product, and use each respondent's part-worths to predict which product that respondent would choose. Summing across respondents gives predicted shares of preference. The simulator can then answer "what if" questions: what happens to our share if we lower the price, add a feature or a competitor cuts its price? Figure 2 shows an example (Orme, 2014).
Beyond marketing
Conjoint methods are also used in health research to measure patients' preferences for treatments, in transport research to value travel time, and in political science to study how voters weigh candidates' characteristics. Hainmueller et al. (2014) set out the conditions under which conjoint experiments identify the causal effects of attributes, and Hainmueller et al. (2015) found that a conjoint survey of attitudes towards naturalisation applicants closely matched the results of real referendums on those applicants.
Limits
Conjoint analysis has several limits that users should keep in mind:
- Hypothetical choices. Respondents do not spend real money, so the method tends to overstate willingness to pay, even though it usually ranks options well.
- Attributes left out. The results describe only the attributes included. If an important attribute is missing, its influence is attributed to others or ignored.
- Simplifying strategies. Faced with many tasks, some respondents choose by a single attribute, such as price, which can distort estimates.
- Market conditions. Shares of preference assume that all customers know about all products and can buy them, so they are not the same as market shares. Adjustments for awareness and distribution are needed before forecasting sales.
Practical guidance
- Choose attributes and levels from qualitative research with customers, not from internal assumptions.
- Keep the number of attributes and tasks manageable, and test the survey on a small sample first.
- Include a "none" option so that the results show whether customers would buy at all.
- Use samples large enough for the analysis; 300 or more respondents is common for choice-based studies.
- Validate results with holdout tasks that are not used in estimation, and, where possible, with market data.
An example
A laptop maker is choosing between two upgrades for a new model: a longer battery life or a lighter case. Each would add about the same to the production cost. It runs a choice-based conjoint study with 500 target customers, each completing 12 tasks with three laptops and a "none" option. The attributes are brand, price, battery life, weight and colour. The part-worths show that customers value an extra four hours of battery life about twice as much as a 300-gram reduction in weight. The simulator predicts that adding the longer battery would raise the new laptop's share of preference from 22 to 31 per cent, while the lighter case would raise it only to 26 per cent. Individual estimates also show a segment of frequent travellers, about a fifth of the sample, who value low weight highly; the company decides to offer a lighter version later for that segment (illustrative example).
Conclusion
Conjoint analysis measures what customers value by observing how they trade features against each other and against price. Its realistic choice tasks, individual-level estimates and market simulations make it one of the most useful tools in survey research for product design and pricing. Careful choice of attributes, good experimental design and awareness of the gap between hypothetical and real choices keep its results grounded.
References
Allenby, G. M., & Rossi, P. E. (1998). Marketing models of consumer heterogeneity. Journal of Econometrics, 89(1–2), 57–78. https://doi.org/10.1016/S0304-4076(98)00055-4
Green, P. E., & Rao, V. R. (1971). Conjoint measurement for quantifying judgmental data. Journal of Marketing Research, 8(3), 355–363. https://doi.org/10.1177/002224377100800312
Green, P. E., & Srinivasan, V. (1990). Conjoint analysis in marketing: New developments with implications for research and practice. Journal of Marketing, 54(4), 3–19. https://doi.org/10.1177/002224299005400402
Green, P. E., Krieger, A. M., & Wind, Y. (2001). Thirty years of conjoint analysis: Reflections and prospects. Interfaces, 31(3, Suppl.), S56–S73. https://doi.org/10.1287/inte.31.3s.56.9676
Hainmueller, J., Hangartner, D., & Yamamoto, T. (2015). Validating vignette and conjoint survey experiments against real-world behavior. Proceedings of the National Academy of Sciences, 112(8), 2395–2400. https://doi.org/10.1073/pnas.1416587112
Hainmueller, J., Hopkins, D. J., & Yamamoto, T. (2014). Causal inference in conjoint analysis: Understanding multidimensional choices via stated preference experiments. Political Analysis, 22(1), 1–30. https://doi.org/10.1093/pan/mpt024
Huber, J., & Zwerina, K. (1996). The importance of utility balance in efficient choice designs. Journal of Marketing Research, 33(3), 307–317. https://doi.org/10.1177/002224379603300305
Lenk, P. J., DeSarbo, W. S., Green, P. E., & Young, M. R. (1996). Hierarchical Bayes conjoint analysis: Recovery of partworth heterogeneity from reduced experimental designs. Marketing Science, 15(2), 173–191. https://doi.org/10.1287/mksc.15.2.173
Louviere, J. J., & Woodworth, G. (1983). Design and analysis of simulated consumer choice or allocation experiments: An approach based on aggregate data. Journal of Marketing Research, 20(4), 350–367. https://doi.org/10.1177/002224378302000403
Louviere, J. J., Hensher, D. A., Swait, J. D., & Adamowicz, W. (2000). Stated choice methods: Analysis and applications. Cambridge University Press. https://doi.org/10.1017/CBO9780511753831
Luce, R. D., & Tukey, J. W. (1964). Simultaneous conjoint measurement: A new type of fundamental measurement. Journal of Mathematical Psychology, 1(1), 1–27. https://doi.org/10.1016/0022-2496(64)90015-X
McFadden, D. (1974). Conditional logit analysis of qualitative choice behavior. In P. Zarembka (Ed.), Frontiers in econometrics (pp. 105–142). Academic Press.
Orme, B. K. (2014). Getting started with conjoint analysis: Strategies for product design and pricing research (3rd ed.). Research Publishers.
Toubia, O., Simester, D. I., Hauser, J. R., & Dahan, E. (2003). Fast polyhedral adaptive conjoint estimation. Marketing Science, 22(3), 273–303. https://doi.org/10.1287/mksc.22.3.273.17743
Wittink, D. R., & Cattin, P. (1989). Commercial use of conjoint analysis: An update. Journal of Marketing, 53(3), 91–96. https://doi.org/10.1177/002224298905300310