
Surveys · Types and applications
MaxDiff Scaling: Measuring Relative Preference and Importance
MaxDiff, or best-worst scaling, asks respondents to pick the most and least important items from small sets. This article explains how the method works, why it discriminates between items better than rating scales, how studies are designed and analysed, and where it is used.
Survey researchers often need to know which of many items matter most to people: which product features, which policy priorities, which reasons for choosing a supplier, which personal values. The obvious approach is to ask respondents to rate each item on a scale of importance. The results are often disappointing. Most items are rated important, the averages sit close together, and the ranking of items depends heavily on how individual respondents use the scale. MaxDiff, short for maximum difference scaling and also known as best-worst scaling, was developed to solve this problem. Instead of rating items one at a time, respondents see small sets of items and choose the most and the least important in each set (Louviere et al., 2015).
This article explains how MaxDiff works, why it produces clearer results than rating scales, how studies are designed and analysed, and what its limits are.
The problem with rating scales
Rating scales are easy to answer and easy to analyse, but they have well-known weaknesses when the aim is to compare items. Because rating an item as important costs the respondent nothing, many respondents rate almost everything near the top of the scale. Differences between items are compressed, and it becomes hard to tell which items really matter more.
Respondents also differ in how they use scales. Some use the extremes freely, while others stay near the middle; some tend to agree with whatever is put to them. These response styles vary between individuals and between cultures, so differences in average ratings between groups or countries can reflect differences in scale use rather than in priorities (Baumgartner & Steenkamp, 2001). Comparisons of rating and ranking methods for measuring values showed that the two can lead to different conclusions, and that rankings avoid some of the distortions introduced by individual differences in scale use (Alwin & Krosnick, 1985; Krosnick & Alwin, 1988). But full rankings of many items are tiring and become unreliable when the list is long.
MaxDiff keeps the advantage of ranking, forcing respondents to make choices between items, while asking them to rank only a small number of items at a time.
How MaxDiff works
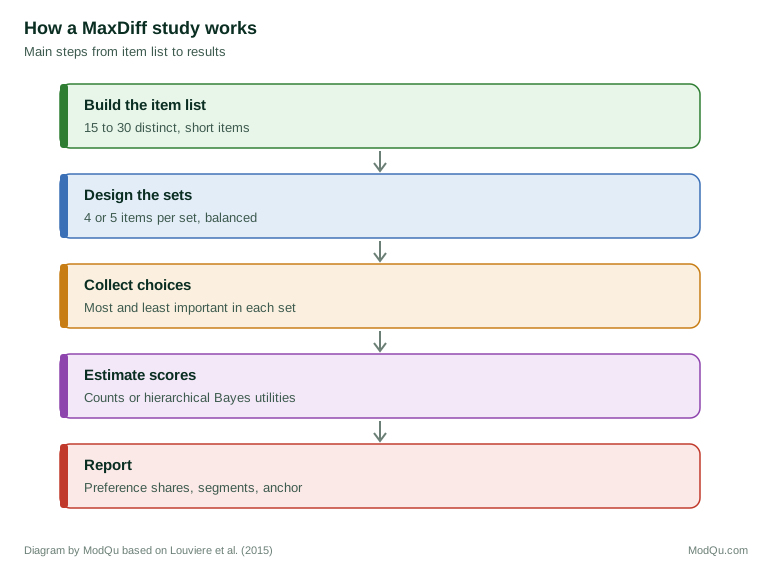
In a MaxDiff task, the respondent sees a set of typically four or five items and is asked to choose the one that is most important, or most appealing, and the one that is least. A study contains a series of such tasks, each with a different set of items drawn from a larger list, often of 15 to 30 items. Over the series, each item appears several times, alongside different combinations of other items. Figure 1 shows the main steps.
Each best and worst choice gives a lot of information. If a respondent sees items A, B, C and D and chooses A as best and D as worst, the researcher learns five of the six possible comparisons between the pairs: A is preferred to B, C and D, and B and C are each preferred to D. Only the comparison between B and C is unknown. Because the task asks for clear choices, it removes the option of rating everything as important and is unaffected by differences in how respondents use a scale.
The method was introduced by Finn and Louviere (1992), who used it to measure public concern about food safety issues. Its theoretical basis lies in the long tradition of choice models in psychology and economics, going back to the law of comparative judgement (Thurstone, 1927) and developed through random utility models of choice (McFadden, 1974). Marley and Louviere (2005) set out the probabilistic models that describe best, worst and best-worst choices, giving the method a formal foundation.
Three forms of best-worst scaling
Louviere et al. (2015) and Flynn et al. (2007) distinguish three forms of best-worst scaling:
- Case 1, the object case. Respondents choose the best and worst from sets of separate items, such as product features or policy goals. This is what most practitioners mean by MaxDiff.
- Case 2, the profile case. Respondents see a single profile, such as a description of a product or a health state made up of several attributes, and choose its best and worst attribute levels.
- Case 3, the multi-profile case. Respondents choose the best and worst among several complete profiles, which makes the task an extension of choice-based conjoint analysis (Marley & Pihlens, 2012).
This article concentrates on Case 1, which is by far the most common in market and social research (Louviere et al., 2013).
Designing a MaxDiff study
Building the item list
The quality of a MaxDiff study depends on the list of items. Items should be distinct, so that respondents are not forced to choose between two versions of the same idea, and they should be stated at a similar level of detail. A list that mixes broad items such as "quality" with narrow ones such as "a two-year guarantee" invites confusing comparisons. Items should be short enough to read quickly, because each item is read many times. Qualitative research, earlier surveys and the questions decision makers need to answer are good sources for the list.
The experimental design
The researcher then decides how many items to show in each set, how many sets each respondent completes and which items appear together. Common practice is to show four or five items per set when items are short, and three or four when they are long. Each item should appear at least three times for each respondent if individual-level scores are needed, which with 20 items and five per set means about 12 sets (Chrzan & Orme, 2019).
The combinations follow an experimental design with several properties. Each item should appear about equally often, each pair of items should appear together about equally often, and each item should appear about equally often in each position in the set, so that position does not bias choices. Designs that achieve this balance closely are called balanced incomplete block designs; when exact balance is impossible, computer algorithms find near-balanced designs. Different respondents can receive different versions of the design, which improves the balance across the whole sample (Louviere et al., 2015). The principles are similar to those used in designing choice experiments more generally (Huber & Zwerina, 1996).
Wording the task
The question must say clearly what "best" and "worst" mean, such as "most important when choosing a bank" and "least important when choosing a bank". The same criterion must apply to both choices. The task should also be explained with an example before the first set, because some respondents are unfamiliar with choosing in both directions.
Analysing MaxDiff data
Counting scores
The simplest analysis counts how often each item was chosen as best and as worst. A best-minus-worst score subtracts the worst count from the best count and divides by the number of times the item was shown. Scores range from −1, for an item always chosen as worst, to +1, for an item always chosen as best. With a balanced design, these counts are closely related to the estimates from formal models and are easy to explain (Flynn et al., 2007). Hollis (2018) compared several scoring methods for large, unbalanced designs and found that simple counts often perform well, although model-based methods are better when designs are less balanced.
Choice models
Formal analysis uses choice models, usually versions of the multinomial logit model, to estimate a utility for each item: a number on a common scale showing how strongly the item is preferred (Marley & Louviere, 2005). Most commercial studies now estimate utilities for each respondent using hierarchical Bayes methods, which combine each respondent's choices with information from the whole sample (Lenk et al., 1996; Allenby & Rossi, 1998). Individual utilities allow respondents to be grouped into segments with similar priorities, and allow the scores of different groups to be compared.
Preference shares
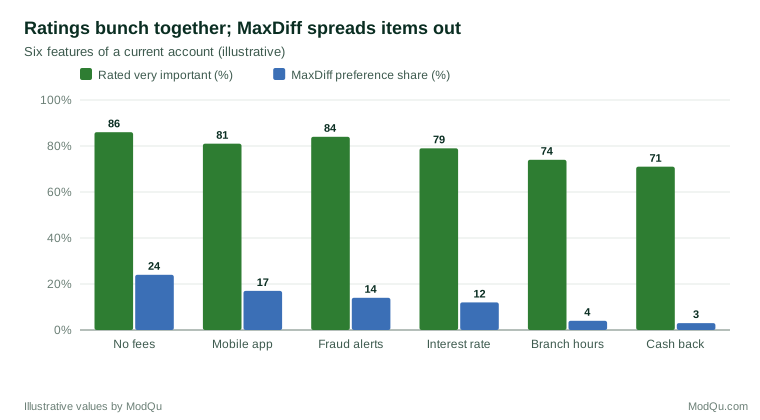
Utilities are often transformed into preference shares, which sum to 100 per cent across items. A share shows the probability that an item would be chosen as most important from the whole list, according to the model. Shares are on a ratio scale: an item with a share of 20 per cent is twice as preferred as one with 10 per cent. This makes results easy to communicate, as shown in Figure 2, which compares MaxDiff shares with ratings of the same items.
Anchored MaxDiff
Standard MaxDiff shows which items are more important than others, but not whether any of them are important in an absolute sense. A respondent who cares little about all the items still has to choose a best one. Anchored MaxDiff adds questions that link the scores to a threshold, for example by asking after each set whether all, some or none of the items shown are important, or by asking respondents to sort the items into important and not important at the end. The threshold allows researchers to say which items matter at all, as well as which matter most (Chrzan & Orme, 2019).
Evidence on reliability and validity
Several studies have compared MaxDiff with rating scales. Lee et al. (2007, 2008) measured personal values with both best-worst scaling and rating scales and found that best-worst scaling discriminated between values more clearly, was free of response-style differences and predicted related attitudes and behaviour as well as or better than ratings. Auger et al. (2007) used best-worst scaling to compare the importance of ethical issues for consumers in six countries, showing that the method allowed comparisons between countries that ratings would distort through differences in scale use.
Studies in other fields point the same way. Hollis and Westbury (2018) compared best-worst scaling with rating scales and numerical estimates for collecting judgements about words and found that best-worst scaling gave more reliable results for the same effort. Kiritchenko and Mohammad (2017) found the same for judgements of how positive or negative phrases were. In health research, best-worst scaling is now widely used to measure patients' priorities and preferences for treatments, and reviews show its rapid growth in that field (Mühlbacher et al., 2016; Cheung et al., 2016).
Applications
MaxDiff is used wherever a list of items must be put in order of importance or appeal:
- Product features. Which features to include in a new product or to emphasise in advertising.
- Messages and claims. Which of many possible advertising claims is most persuasive.
- Brand image. Which qualities customers most associate with a brand.
- Customer priorities. Which aspects of service matter most to customers, as a guide to where to invest.
- Employee research. Which benefits or workplace changes employees value most.
- Public policy. Which issues or spending priorities citizens consider most urgent.
- Health care. Which outcomes or treatment features matter most to patients.
- Wine and food. Cohen (2009) showed how best-worst scaling can identify what drives consumers' choice of wine, in a market where ratings of many attributes were all high.
MaxDiff and conjoint analysis
MaxDiff and conjoint analysis are related but answer different questions. Conjoint analysis shows complete products made up of several attributes, such as brand, price and features, and measures how much each level of each attribute contributes to a choice. It is suited to designing products and setting prices, because it captures trade-offs between attributes in the form customers actually meet them. MaxDiff compares separate items that need not belong to a single product, such as a list of possible features, messages or priorities. It is suited to screening and ranking long lists, and it is often used before a conjoint study to select the few attributes that matter most. A common sequence is to use MaxDiff to reduce 25 candidate features to the six most valued, and then to use conjoint analysis to decide how those six should be combined and priced (Louviere et al., 2013).
Practical guidance
- Keep the list focused. More than 30 items makes each item appear too rarely for reliable individual scores unless the number of sets is increased. Large lists can be split between respondents, with scores estimated for the sample as a whole.
- Write items carefully. Each item should be distinct, short and at the same level of detail.
- Use a balanced design from established software rather than a hand-made one.
- Explain the task with an example and keep the "best" and "worst" criteria consistent.
- Watch for speeding. Respondents who click through sets quickly give inconsistent choices; individual fit statistics from hierarchical Bayes models help to identify them.
- Add an anchor when decisions depend on whether items matter at all, not only which matter more.
- Report shares or scores clearly, with an explanation that they are relative to the other items in the list.
Limits
MaxDiff has limits that users should keep in mind. The results are relative to the list: an item's share depends on which other items are included, and adding or removing items changes all the shares. Without an anchor, the method cannot show whether items are important in absolute terms. Each set takes longer than a single rating, so a MaxDiff exercise adds to the length of a survey, and many sets can tire respondents. The method also assumes that items can be compared on a single dimension of importance or appeal, which may not suit items that matter in different ways or to different decisions.
An example
A bank wants to know which features matter most to customers when choosing a current account. A rating question for 12 features shows that between 71 and 86 per cent of respondents rate each feature as very important, which gives little guidance. The bank then runs a MaxDiff study with 600 customers, each completing nine sets of four features. The preference shares are much more spread out: no monthly fees has a share of 24 per cent, a good mobile app 17 per cent and fast fraud alerts 14 per cent, while branch opening hours and cash-back offers have shares below 5 per cent. Segments based on individual utilities show that younger customers put a mobile app first, while older customers put branch access higher. The bank uses the results to decide which features to emphasise in advertising to each group (illustrative example).
Conclusion
MaxDiff replaces the question "how important is this?" with a series of simpler choices: which is most important, and which is least? Those choices remove the compression and response-style bias of rating scales, produce scores on a common ratio scale and discriminate clearly between items. With a well-chosen list of items, a balanced design and appropriate analysis, MaxDiff gives decision makers a clear view of what matters most to the people they serve.
References
Allenby, G. M., & Rossi, P. E. (1998). Marketing models of consumer heterogeneity. Journal of Econometrics, 89(1–2), 57–78. https://doi.org/10.1016/S0304-4076(98)00055-4
Alwin, D. F., & Krosnick, J. A. (1985). The measurement of values in surveys: A comparison of ratings and rankings. Public Opinion Quarterly, 49(4), 535–552. https://doi.org/10.1086/268949
Auger, P., Devinney, T. M., & Louviere, J. J. (2007). Using best–worst scaling methodology to investigate consumer ethical beliefs across countries. Journal of Business Ethics, 70(3), 299–326. https://doi.org/10.1007/s10551-006-9112-7
Baumgartner, H., & Steenkamp, J.-B. E. M. (2001). Response styles in marketing research: A cross-national investigation. Journal of Marketing Research, 38(2), 143–156. https://doi.org/10.1509/jmkr.38.2.143.18840
Cheung, K. L., Wijnen, B. F. M., Hollin, I. L., Janssen, E. M., Bridges, J. F., Evers, S. M. A. A., & Hiligsmann, M. (2016). Using best–worst scaling to investigate preferences in health care. PharmacoEconomics, 34(12), 1195–1209. https://doi.org/10.1007/s40273-016-0429-5
Chrzan, K., & Orme, B. K. (2019). Applied MaxDiff: A practitioner's guide to best-worst scaling. Sawtooth Software.
Cohen, E. (2009). Applying best-worst scaling to wine marketing. International Journal of Wine Business Research, 21(1), 8–23. https://doi.org/10.1108/17511060910948008
Finn, A., & Louviere, J. J. (1992). Determining the appropriate response to evidence of public concern: The case of food safety. Journal of Public Policy & Marketing, 11(2), 12–25. https://doi.org/10.1177/074391569201100202
Flynn, T. N., Louviere, J. J., Peters, T. J., & Coast, J. (2007). Best–worst scaling: What it can do for health care research and how to do it. Journal of Health Economics, 26(1), 171–189. https://doi.org/10.1016/j.jhealeco.2006.04.002
Hollis, G., & Westbury, C. (2018). When is best-worst best? A comparison of best-worst scaling, numeric estimation, and rating scales for collection of semantic norms. Behavior Research Methods, 50(1), 115–133. https://doi.org/10.3758/s13428-017-1009-0
Hollis, G. (2018). Scoring best-worst data in unbalanced many-item designs, with applications to crowdsourcing semantic judgments. Behavior Research Methods, 50(2), 711–729. https://doi.org/10.3758/s13428-017-0898-2
Huber, J., & Zwerina, K. (1996). The importance of utility balance in efficient choice designs. Journal of Marketing Research, 33(3), 307–317. https://doi.org/10.1177/002224379603300305
Kiritchenko, S., & Mohammad, S. M. (2017). Best-worst scaling more reliable than rating scales: A case study on sentiment intensity annotation. In Proceedings of the 55th Annual Meeting of the Association for Computational Linguistics (Vol. 2, pp. 465–470). Association for Computational Linguistics. https://doi.org/10.18653/v1/P17-2074
Krosnick, J. A., & Alwin, D. F. (1988). A test of the form-resistant correlation hypothesis: Ratings, rankings, and the measurement of values. Public Opinion Quarterly, 52(4), 526–538. https://doi.org/10.1086/269128
Lee, J. A., Soutar, G., & Louviere, J. (2008). The best–worst scaling approach: An alternative to Schwartz's Values Survey. Journal of Personality Assessment, 90(4), 335–347. https://doi.org/10.1080/00223890802107925
Lee, J. A., Soutar, G. N., & Louviere, J. (2007). Measuring values using best-worst scaling: The LOV example. Psychology & Marketing, 24(12), 1043–1058. https://doi.org/10.1002/mar.20197
Lenk, P. J., DeSarbo, W. S., Green, P. E., & Young, M. R. (1996). Hierarchical Bayes conjoint analysis: Recovery of partworth heterogeneity from reduced experimental designs. Marketing Science, 15(2), 173–191. https://doi.org/10.1287/mksc.15.2.173
Louviere, J. J., Flynn, T. N., & Marley, A. A. J. (2015). Best-worst scaling: Theory, methods and applications. Cambridge University Press. https://doi.org/10.1017/CBO9781107337855
Louviere, J., Lings, I., Islam, T., Gudergan, S., & Flynn, T. (2013). An introduction to the application of (case 1) best–worst scaling in marketing research. International Journal of Research in Marketing, 30(3), 292–303. https://doi.org/10.1016/j.ijresmar.2012.10.002
Marley, A. A. J., & Louviere, J. J. (2005). Some probabilistic models of best, worst, and best–worst choices. Journal of Mathematical Psychology, 49(6), 464–480. https://doi.org/10.1016/j.jmp.2005.05.003
Marley, A. A. J., & Pihlens, D. (2012). Models of best–worst choice and ranking among multiattribute options (profiles). Journal of Mathematical Psychology, 56(1), 24–34. https://doi.org/10.1016/j.jmp.2011.09.001
McFadden, D. (1974). Conditional logit analysis of qualitative choice behavior. In P. Zarembka (Ed.), Frontiers in econometrics (pp. 105–142). Academic Press.
Mühlbacher, A. C., Kaczynski, A., Zweifel, P., & Johnson, F. R. (2016). Experimental measurement of preferences in health and healthcare using best-worst scaling: An overview. Health Economics Review, 6, Article 2. https://doi.org/10.1186/s13561-015-0079-x
Thurstone, L. L. (1927). A law of comparative judgment. Psychological Review, 34(4), 273–286. https://doi.org/10.1037/h0070288