
Surveys · Types and applications
Health Surveys and the Measurement of Population Wellbeing
Health surveys measure illness, health behaviours, use of health care and quality of life in whole populations. This article explains the main types of health survey, the standard measures they use, the special problems of self-reported health and how surveys are combined with physical measurements.
Records from hospitals and doctors show who receives care, but not who is ill without being treated, how people rate their own health, or how they eat, drink, smoke and exercise. Health surveys fill that gap. By asking a sample of the population about their health and behaviour, and sometimes taking physical measurements, they show how common illness and risk factors are, how they differ between groups and how they change over time. Their results guide public health policy, the planning of services and the evaluation of programmes (Aday & Cornelius, 2006; Johnson, 2015).
Types of health survey
National health interview surveys
Many countries run a continuing national health survey. The National Health Interview Survey in the United States has interviewed households about illness, disability and use of care since 1957. Other examples include the Canadian Community Health Survey and the Health Survey for England. These surveys use probability samples of households and usually interview in person, producing estimates that are trusted for official purposes.
Risk factor surveillance
Surveillance surveys track health behaviours such as smoking, drinking, diet, physical activity and screening. The Behavioral Risk Factor Surveillance System in the United States, begun in 1984, interviews several hundred thousand adults each year, enough to produce estimates for every state (Mokdad, 2009). Similar surveys monitor the health behaviours of young people in schools.
Examination surveys
Health examination surveys add physical measurements and laboratory tests to the interview. Respondents are measured for height, weight and blood pressure, and give samples of blood or urine. These surveys can identify conditions that people do not know they have, such as undiagnosed diabetes or high blood pressure, and they provide a check on what people report about themselves.
Cohort and longitudinal studies
Cohort studies follow the same people over many years, linking their health and behaviour at one time to illness and death later. Some, such as UK Biobank, recruit very large numbers of volunteers. Their participants are often healthier and better off than the general population, which matters for estimating how common a condition is but less so for studying relationships between risk factors and outcomes (Fry et al., 2017).
Samples and modes
Most official health surveys use probability samples of addresses or households, selected in several stages so that interviewers can work in a limited number of areas. Within each household, one or more adults are selected at random, and in some surveys every member of the household is included. Because many health conditions are rare, samples need to be large, and groups of particular interest, such as older people, children or minority groups, are often sampled at higher rates than others and then weighted back to their true share of the population.
The choice of mode matters more in health surveys than in many others. Face-to-face interviews achieve the highest response rates among older and less healthy people and allow physical measurements in the same visit, but they are expensive. Telephone surveys are cheaper but have suffered from falling response rates and the shift from landlines to mobile phones. Online and postal questionnaires are cheaper still and provide privacy for sensitive questions, but they may exclude people with poor eyesight, limited literacy or no internet access, groups whose health is often worse than average. Many health surveys now combine modes, starting with a cheaper one and following up nonrespondents with an interviewer.
What health surveys measure
Self-rated health
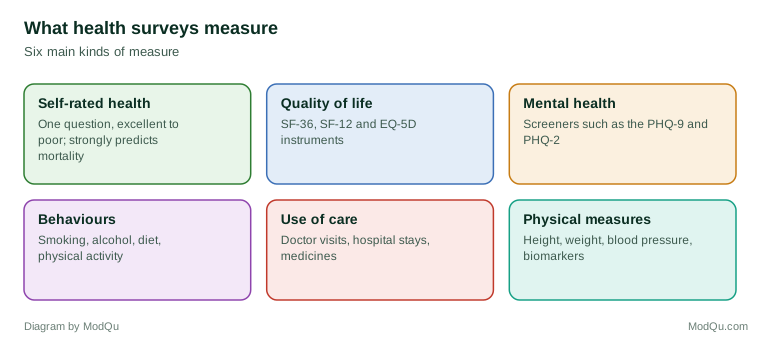
The simplest and most widely used health question asks people to rate their own health, usually as excellent, very good, good, fair or poor. This single question is a remarkably strong predictor of future health. Idler and Benyamini (1997) reviewed 27 community studies and found that self-rated health predicted death even after taking account of medical conditions and other risk factors. A later meta-analysis confirmed that people who rated their health as poor had about twice the risk of death of those who rated it as excellent (DeSalvo et al., 2006).
Health-related quality of life
Standard instruments measure how health affects daily life. The SF-36 asks 36 questions covering physical functioning, pain, energy, social functioning and mental health (Ware & Sherbourne, 1992), and the shorter SF-12 uses 12 of them (Ware et al., 1996). The EQ-5D, developed by the EuroQol Group (1990), describes health on five dimensions: mobility, self-care, usual activities, pain or discomfort, and anxiety or depression. Its answers can be converted into a single index used in economic evaluations of treatments.
Mental health
Short screening questionnaires measure symptoms of common mental health conditions. The PHQ-9 asks about nine symptoms of depression over the past two weeks and has been validated against clinical interviews (Kroenke et al., 2001); an even shorter two-question version is used as a first screen (Kroenke et al., 2003). Such scales identify likely cases rather than giving diagnoses, but they allow surveys to estimate how common symptoms are and to compare groups. Figure 1 summarises the main kinds of measure.
Health behaviours and use of care
Questions on smoking, alcohol, diet and physical activity measure the behaviours that drive much chronic disease. Questions on visits to doctors, hospital stays and medicines measure use of health care. Both depend on respondents' memory and willingness to report accurately.
Social and environmental conditions
Health depends on more than medical care. Many health surveys also ask about income, employment, housing, education, food security, loneliness and access to green space, which are known as the social determinants of health. Including these questions in the same survey allows researchers to show how health differs between social groups and to track whether those differences are narrowing or widening over time.
The problems of self-report
Health surveys depend on what people say about themselves, and self-reports differ from objective measures in predictable ways.
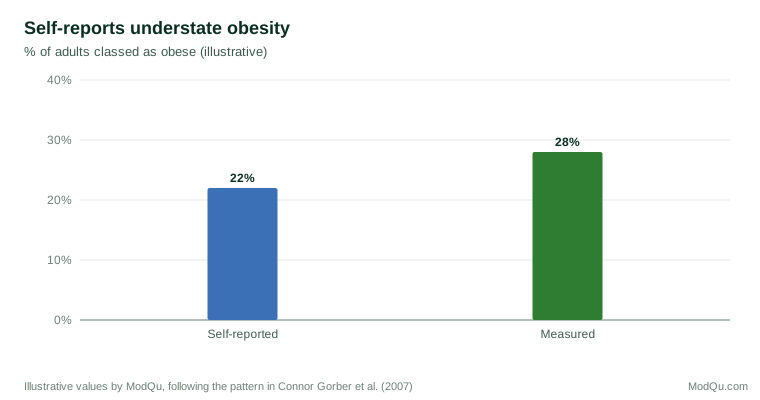
Height and weight. People tend to report that they are taller and lighter than they are. A systematic review found that self-reported weight was generally lower and height higher than measured values, so that obesity estimated from self-reports was lower than obesity measured directly (Connor Gorber et al., 2007). Figure 2 illustrates the effect.
Physical activity. Self-reports of physical activity are often higher than measurements from devices that record movement, although the size of the difference varies widely between studies and questionnaires (Prince et al., 2008).
Use of health care. Recall of doctor visits and hospital stays declines over longer reference periods, and people may place events in the wrong period. Shorter reference periods, memory aids and checking against records improve accuracy (Bhandari & Wagner, 2006).
Sensitive behaviours. Drug use, sexual behaviour and heavy drinking are under-reported, especially when an interviewer asks the questions. Self-completion methods, including computer-assisted self-interviewing, increase reporting of such behaviours (Tourangeau & Yan, 2007). In one study of young men, reports of risky behaviours rose substantially when questions were answered privately on a computer rather than on a paper form (Turner et al., 1998). The validity of reports by adolescents depends on both thinking processes, such as memory, and situational factors, such as privacy (Brener et al., 2003).
Comparability between groups. People in different countries or groups may use the response categories of health questions differently. One group's "good" health may be another's "fair". Anchoring vignettes, short descriptions of hypothetical people with given levels of health that respondents also rate, allow researchers to adjust for these differences (King et al., 2004). Salomon et al. (2004) used vignettes to show that comparisons of self-rated health across countries can change substantially once differences in response scales are taken into account.
Nonresponse
Participation in health surveys and epidemiological studies has fallen over recent decades (Galea & Tracy, 2007). Low response rates do not necessarily mean biased estimates, because bias depends on whether those who take part differ from those who do not on the measures of interest (Groves, 2006). In health surveys, however, there are reasons for concern: people who are very ill may be unable to take part, and people with unhealthy behaviours may be less willing. Health surveys therefore use weighting, follow-up of nonrespondents and comparison with external sources such as death and hospital records to assess and reduce bias.
Combining surveys with other data
Health surveys increasingly combine interviews with other sources of information:
- Physical measurements and biomarkers, which provide objective measures of conditions such as high blood pressure and diabetes. Not all respondents agree to these, and those who do may differ from those who do not (Sakshaug et al., 2010).
- Linkage to health records, with respondents' consent, which allows survey answers to be connected to later diagnoses, treatments and deaths.
- Wearable devices, which record activity and sleep over days or weeks.
- Online panels, which allow rapid and inexpensive surveys of health topics, but whose participants may differ from the general population in health and behaviour (Hays et al., 2015).
Ethics and consent
Health surveys collect some of the most sensitive information people can give. Respondents must be told clearly what will be asked, how their answers will be protected and how they will be used. Physical measurements, blood samples and linkage to health records each require separate, explicit consent, and respondents must be able to agree to the interview while refusing any of these. When measurements reveal a possible problem, such as very high blood pressure, surveys need a plan for telling the respondent and advising them to see a doctor. Data are usually released to researchers only after names, addresses and other identifying details have been removed, and detailed geographic information or rare conditions may be withheld to prevent identification.
Health surveys in emergencies
Health surveys can be adapted quickly when new threats appear. During outbreaks of infectious disease, surveys have been used to estimate how many people have symptoms, how many have been tested, how many follow public health advice and how many are willing to be vaccinated. Some studies have combined questionnaires with home testing kits to estimate how many people are infected, including those without symptoms. These rapid surveys must balance speed against quality: online panels can produce results in days, but probability samples with testing give more reliable estimates of how common an infection is.
Designing a health survey
Good practice includes:
- Using established measures such as the SF-12, EQ-5D or PHQ-9, so that results can be compared with other studies and with population norms.
- Choosing reference periods carefully, short enough for accurate recall but long enough to capture infrequent events.
- Using self-completion for sensitive questions.
- Validating self-reports against physical measurements or records where possible.
- Planning for nonresponse, including weighting and checks against external sources.
- Testing questions with people from the groups being surveyed, especially when measures are used across languages or cultures.
An example
A regional health authority wants to know how many adults have high blood pressure and how many of them know it. It runs a household survey of 4,000 adults with an interview followed by a nurse visit to measure blood pressure. In the interview, 18 per cent report that a doctor has told them they have high blood pressure. The measurements show that 27 per cent have high blood pressure, so about a third of those affected are undiagnosed. The undiagnosed are more often men and people under 50. The authority uses the results to target screening in workplaces (illustrative example).
Conclusion
Health surveys measure what records alone cannot: the health and behaviour of the whole population, including people who never see a doctor. Simple measures such as self-rated health are powerful predictors, and standard instruments allow comparisons across studies and countries. Because self-reports differ from objective measures in predictable ways, the best health surveys combine careful question design with physical measurements, record linkage and attention to nonresponse.
References
Aday, L. A., & Cornelius, L. J. (2006). Designing and conducting health surveys: A comprehensive guide (3rd ed.). Jossey-Bass.
Bhandari, A., & Wagner, T. (2006). Self-reported utilization of health care services: Improving measurement and accuracy. Medical Care Research and Review, 63(2), 217–235. https://doi.org/10.1177/1077558705285298
Brener, N. D., Billy, J. O. G., & Grady, W. R. (2003). Assessment of factors affecting the validity of self-reported health-risk behavior among adolescents: Evidence from the scientific literature. Journal of Adolescent Health, 33(6), 436–457. https://doi.org/10.1016/S1054-139X(03)00052-1
Connor Gorber, S., Tremblay, M., Moher, D., & Gorber, B. (2007). A comparison of direct vs. self-report measures for assessing height, weight and body mass index: A systematic review. Obesity Reviews, 8(4), 307–326. https://doi.org/10.1111/j.1467-789X.2007.00347.x
DeSalvo, K. B., Bloser, N., Reynolds, K., He, J., & Muntner, P. (2006). Mortality prediction with a single general self-rated health question: A meta-analysis. Journal of General Internal Medicine, 21(3), 267–275. https://doi.org/10.1111/j.1525-1497.2005.00291.x
EuroQol Group. (1990). EuroQol—A new facility for the measurement of health-related quality of life. Health Policy, 16(3), 199–208. https://doi.org/10.1016/0168-8510(90)90421-9
Fry, A., Littlejohns, T. J., Sudlow, C., Doherty, N., Adamska, L., Sprosen, T., Collins, R., & Allen, N. E. (2017). Comparison of sociodemographic and health-related characteristics of UK Biobank participants with those of the general population. American Journal of Epidemiology, 186(9), 1026–1034. https://doi.org/10.1093/aje/kwx246
Galea, S., & Tracy, M. (2007). Participation rates in epidemiologic studies. Annals of Epidemiology, 17(9), 643–653. https://doi.org/10.1016/j.annepidem.2007.03.013
Groves, R. M. (2006). Nonresponse rates and nonresponse bias in household surveys. Public Opinion Quarterly, 70(5), 646–675. https://doi.org/10.1093/poq/nfl033
Hays, R. D., Liu, H., & Kapteyn, A. (2015). Use of Internet panels to conduct surveys. Behavior Research Methods, 47(3), 685–690. https://doi.org/10.3758/s13428-015-0617-9
Idler, E. L., & Benyamini, Y. (1997). Self-rated health and mortality: A review of twenty-seven community studies. Journal of Health and Social Behavior, 38(1), 21–37. https://doi.org/10.2307/2955359
Johnson, T. P. (Ed.). (2015). Handbook of health survey methods. Wiley. https://doi.org/10.1002/9781118594629
King, G., Murray, C. J. L., Salomon, J. A., & Tandon, A. (2004). Enhancing the validity and cross-cultural comparability of measurement in survey research. American Political Science Review, 98(1), 191–207. https://doi.org/10.1017/S000305540400108X
Kroenke, K., Spitzer, R. L., & Williams, J. B. W. (2001). The PHQ-9: Validity of a brief depression severity measure. Journal of General Internal Medicine, 16(9), 606–613. https://doi.org/10.1046/j.1525-1497.2001.016009606.x
Kroenke, K., Spitzer, R. L., & Williams, J. B. W. (2003). The Patient Health Questionnaire-2: Validity of a two-item depression screener. Medical Care, 41(11), 1284–1292. https://doi.org/10.1097/01.MLR.0000093487.78664.3C
Mokdad, A. H. (2009). The Behavioral Risk Factors Surveillance System: Past, present, and future. Annual Review of Public Health, 30, 43–54. https://doi.org/10.1146/annurev.publhealth.031308.100226
Prince, S. A., Adamo, K. B., Hamel, M. E., Hardt, J., Connor Gorber, S., & Tremblay, M. (2008). A comparison of direct versus self-report measures for assessing physical activity in adults: A systematic review. International Journal of Behavioral Nutrition and Physical Activity, 5, Article 56. https://doi.org/10.1186/1479-5868-5-56
Sakshaug, J. W., Couper, M. P., & Ofstedal, M. B. (2010). Characteristics of physical measurement consent in a population-based survey of older adults. Medical Care, 48(1), 64–71. https://doi.org/10.1097/MLR.0b013e3181adcbd3
Salomon, J. A., Tandon, A., & Murray, C. J. L. (2004). Comparability of self rated health: Cross sectional multi-country survey using anchoring vignettes. BMJ, 328(7434), 258. https://doi.org/10.1136/bmj.37963.691632.44
Tourangeau, R., & Yan, T. (2007). Sensitive questions in surveys. Psychological Bulletin, 133(5), 859–883. https://doi.org/10.1037/0033-2909.133.5.859
Turner, C. F., Ku, L., Rogers, S. M., Lindberg, L. D., Pleck, J. H., & Sonenstein, F. L. (1998). Adolescent sexual behavior, drug use, and violence: Increased reporting with computer survey technology. Science, 280(5365), 867–873. https://doi.org/10.1126/science.280.5365.867
Ware, J. E., Jr., & Sherbourne, C. D. (1992). The MOS 36-item short-form health survey (SF-36): I. Conceptual framework and item selection. Medical Care, 30(6), 473–483. https://doi.org/10.1097/00005650-199206000-00002
Ware, J. E., Jr., Kosinski, M., & Keller, S. D. (1996). A 12-Item Short-Form Health Survey: Construction of scales and preliminary tests of reliability and validity. Medical Care, 34(3), 220–233. https://doi.org/10.1097/00005650-199603000-00003