
Surveys · Sampling
Address-Based Sampling Innovations for Hard-to-Reach Geographic Populations
Address-based sampling selects households from lists of residential addresses. It offers near-complete coverage in cities but has gaps in rural and remote areas. This article explains how address-based sampling works, where its coverage falls short and the methods researchers use to reach dwellings that standard lists miss.
Address-based sampling selects households from a list of residential addresses, usually derived from the postal service's delivery records or from a national address register. It became a leading method for general population surveys in the early twenty-first century, as telephone surveys lost coverage and response (Link et al., 2008; Iannacchione, 2011). Addresses offer a frame that includes households regardless of how they use telephones or the internet, and they can be contacted by mail, visited in person and linked to geographic information.
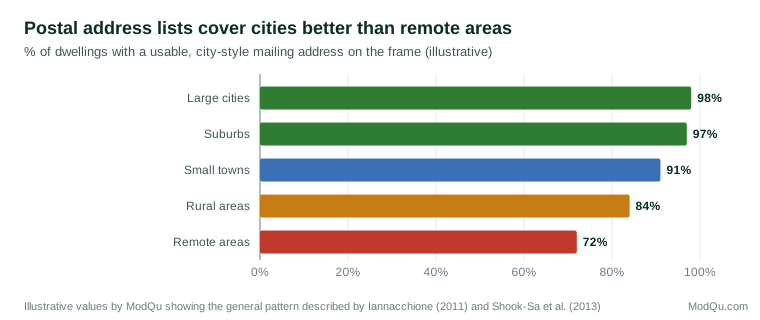
Address lists are not equally complete everywhere. They tend to be most accurate in cities and least accurate in rural and remote areas, where dwellings may lack a city-style street address, mail may go to post office boxes and new or informal housing may not be listed (Iannacchione, 2011; Shook-Sa et al., 2013). These are often the places where knowledge is thinnest, so the gaps matter. This article explains how address-based sampling works, where its coverage falls short and the innovations researchers use to reach hard-to-reach geographic populations.
How address-based sampling works
In the United States, address-based samples are usually drawn from the postal service's Computerized Delivery Sequence File, made available through commercial vendors. Other countries use comparable sources: the United Kingdom uses the Postcode Address File, and some countries have national address or population registers (Lynn & Taylor, 1995). The researcher selects a probability sample of addresses, often stratified by geography, and contacts each selected household.
Before address lists became widely available, household surveys relied on field listing: staff visited sampled areas and wrote down every dwelling. Field listing is thorough but expensive and can vary between listers (Eckman, 2013; Eckman & Kreuter, 2011). Iannacchione et al. (2003) showed that residential mailing addresses could cover most households in a metropolitan area at a fraction of the cost, and later studies found high coverage in most urban and suburban areas (Iannacchione, 2011).
Address-based samples are often contacted by mail. A common approach sends letters inviting household members to complete the survey online, followed by reminders and a paper questionnaire for those who do not respond, sometimes called push-to-web (Messer & Dillman, 2011; Dillman et al., 2014). Address-based samples also support face-to-face and mixed-mode designs. Link et al. (2008) found that a mail survey from an address-based sample obtained higher response rates than a comparable telephone survey in several states.
Because each address can be linked to a location, researchers can add information to the frame. Census data for small areas, such as income or age profiles, can be appended to every address, and commercial databases can add predicted household characteristics such as the presence of children or the age of residents. These additions support stratification and targeting (Valliant et al., 2014).
Where coverage falls short
Coverage gaps in address-based samples are concentrated in particular kinds of places. Figure 1 illustrates the general pattern.
Several features of rural and remote areas cause these gaps (Iannacchione, 2011; Shook-Sa et al., 2013; Harter et al., 2016):
- Non-city-style addresses. Rural route and box numbers describe where mail is delivered, not where people live. They are hard to locate on a map and hard to link to area data.
- Post office boxes. Some households receive mail only at a post office box. Including boxes risks duplication with street addresses; excluding them misses households that have no other address.
- Mail delivered elsewhere. In some remote communities, mail is collected from a central point, and individual dwellings are not listed at all.
- New and informal housing. New developments, converted buildings, mobile homes and seasonal dwellings may not yet appear on delivery lists.
- Multi-unit buildings. Addresses for apartments or rooms within a building may be missing unit numbers, making it unclear which household was selected.
Coverage gaps are not random. Households missed by address lists are more likely to be in rural and low-income areas and to belong to groups such as Indigenous communities, farm workers and people living in non-standard housing (Tourangeau et al., 2014). Surveys that ignore the gaps can understate rural poverty, overstate access to services and miss the conditions of communities that are already under-represented in research.
Innovations for hard-to-reach areas
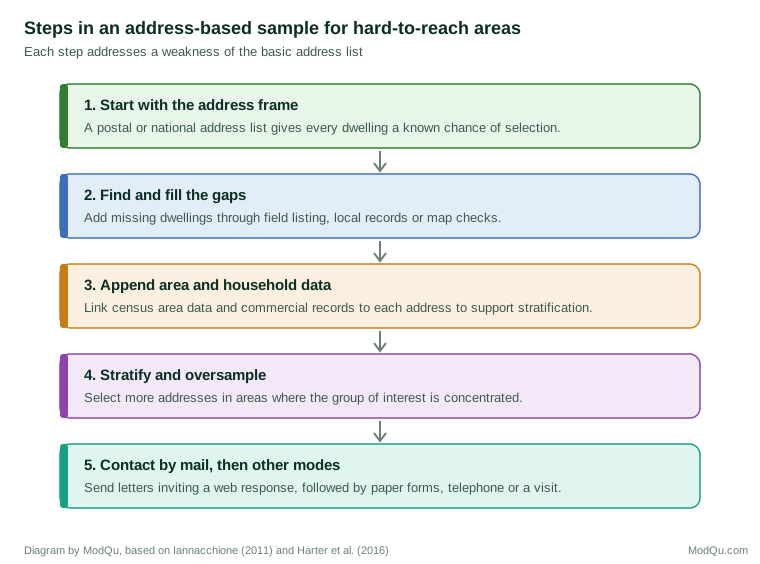
Researchers have developed several ways to extend address-based sampling into areas where lists are weak. Figure 2 summarises a typical sequence of steps.
Supplementing the frame
The most direct approach is to add the dwellings that the list misses. In areas where list coverage is predicted to be low, researchers can combine the address list with field listing, using the list where it is reliable and sending staff to list dwellings where it is not. Models of the match between postal lists and field listing can help decide where field listing is needed (Iannacchione, 2011; Harter et al., 2016).
A less costly approach is to check for missed dwellings near selected addresses. In the half-open interval method and related procedures, interviewers check for unlisted dwellings between a selected address and the next listed address and include any they find. Each unlisted dwelling has a chance of selection through its link to a listed address. McMichael et al. (2008) and Shook-Sa et al. (2013) described such procedures for supplementing address-based frames and showed that they can extend coverage in areas with incomplete lists.
Other sources can also fill gaps: local government property records, utility connections, building permits for new developments and satellite or aerial imagery that shows dwellings not found on any list. Each source has its own errors, and combining sources requires care to avoid counting the same dwelling twice.
Using geography to target rare groups
Appending area information allows researchers to oversample places where a group of interest is concentrated. Brick et al. (2011) showed how address-based samples can be stratified by area characteristics to improve the efficiency of surveys of subpopulations, such as particular age or ethnic groups. Commercial household data can improve targeting further, although such data are often incomplete or inaccurate for individual households (Pasek et al., 2014; Valliant et al., 2014). Because these methods change selection probabilities, survey weights must reflect them.
Choosing contact methods that work locally
Even when a dwelling is on the frame, mail contact may fail. Letters may not reach households with non-standard addresses, and internet access may be limited in remote areas. Mixed-mode designs that follow mail with telephone calls or visits can reach households that do not respond by mail or web (Dillman et al., 2014). Smyth et al. (2010) found that address-based mail and web surveys could reach residents of small towns and rural communities, but that web-only approaches excluded those with limited internet access, which supports offering paper or other modes alongside the web.
Selecting a respondent within the household
An address identifies a dwelling, not a person. To produce a probability sample of individuals, the survey must select one or more people within each household. Methods include asking for the adult with the next birthday or listing household members and selecting one at random. Battaglia et al. (2008) and Olson et al. (2014) found that these methods are often applied incorrectly in mail surveys, which can bias results towards people who are more willing to respond. Clear instructions and, where possible, interviewer-administered selection help.
Measuring and correcting coverage
Before a survey relies on an address list in a particular region, its coverage should be measured. One method compares the list with an independent field listing of a sample of small areas. The share of listed dwellings that also appear on the address list estimates coverage, and the characteristics of areas with low coverage show where supplementation is needed (Iannacchione et al., 2003; Iannacchione, 2011). Another method compares counts of addresses with census counts of dwellings for each small area. Large shortfalls point to areas where addresses are missing or grouped under a single delivery point.
Where gaps remain after supplementation, weighting can reduce, but not remove, their effect. Weights can be adjusted so that the sample matches known population totals by region, area type, age and sex. This corrects for differences in the number of people covered, but it assumes that covered people in an area resemble those who were missed. That assumption is weakest where the missed households live in different kinds of housing or have different ways of life from those on the list (Groves et al., 2009; Lohr, 2021). Weighting is therefore a complement to better frame coverage, not a substitute for it.
Comparison with other frames
Address-based sampling is one of several frames for general population surveys, and each has its own pattern of coverage. Telephone samples miss households without telephones and suffer from low response. Area probability samples with field listing can cover remote dwellings well but cost much more per interview. Online panels and other non-probability sources are inexpensive but have no known selection probabilities and tend to under-represent people with limited internet access, many of whom live in rural areas. In many studies, the most practical design combines an address-based sample in well-covered areas with field listing or other frames in poorly covered ones, which is a form of multiple-frame design (Kalton, 2009; Harter et al., 2016).
In practice
A research organisation planning a survey of household energy use in a large province with many remote communities might proceed as follows. It draws an address sample stratified by region, with more addresses selected in remote areas to ensure enough responses for separate estimates. It identifies communities where mail is delivered to central collection points and where lists are known to be incomplete. In those communities, it works with local organisations to list dwellings and sends interviewers to visit selected households. Elsewhere, it sends letters inviting an online response, followed by paper questionnaires and telephone follow-up where numbers can be matched. Weights account for the different selection probabilities in each stratum and for nonresponse. Coverage in remote areas improves from about seven in ten dwellings to more than nine in ten, and the survey can report energy costs in remote communities with useful precision (illustrative example).
Common problems
Address-based sampling in hard-to-reach areas brings several recurring problems:
- Duplication. The same household may appear under a street address and a post office box. Duplicates should be identified or the multiplicity of each household recorded so that weights can be adjusted.
- Ineligible addresses. Lists include vacant dwellings, businesses and seasonal homes. These add cost and must be recorded so that response rates are calculated correctly (American Association for Public Opinion Research, 2023).
- Inaccurate appended data. Commercial data can mislead targeting and should not be treated as true values (Pasek et al., 2014).
- Lister variation. Where field listing is used, different listers may produce different lists, so training and quality checks are important (Eckman, 2013).
Conclusion
Address-based sampling has given survey researchers a frame with high coverage in most places, flexible contact options and rich geographic information. Its weaknesses are concentrated in rural and remote areas, in non-standard housing and among groups that are already under-represented. Supplementing the list where it is weak, using geography to target sampling, offering contact modes that work locally and selecting respondents carefully within households can extend address-based samples to these populations. The result is knowledge that describes whole regions, not only the places where addresses are easy to find.
References
American Association for Public Opinion Research. (2023). Standard definitions: Final dispositions of case codes and outcome rates for surveys (10th ed.). AAPOR. https://aapor.org/standards-and-ethics/standard-definitions/
Battaglia, M. P., Link, M. W., Frankel, M. R., Osborn, L., & Mokdad, A. H. (2008). An evaluation of respondent selection methods for household mail surveys. Public Opinion Quarterly, 72(3), 459–469. https://doi.org/10.1093/poq/nfn026
Brick, J. M., Williams, D., & Montaquila, J. M. (2011). Address-based sampling for subpopulation surveys. Public Opinion Quarterly, 75(3), 409–428. https://doi.org/10.1093/poq/nfr023
Dillman, D. A., Smyth, J. D., & Christian, L. M. (2014). Internet, phone, mail, and mixed-mode surveys: The tailored design method (4th ed.). Wiley.
Eckman, S., & Kreuter, F. (2011). Confirmation bias in housing unit listing. Public Opinion Quarterly, 75(1), 139–150. https://doi.org/10.1093/poq/nfq066
Eckman, S. (2013). Do different listers make the same housing unit frame? Variability in housing unit listing. Journal of Official Statistics, 29(2), 249–259. https://doi.org/10.2478/jos-2013-0021
Groves, R. M., Fowler, F. J., Jr., Couper, M. P., Lepkowski, J. M., Singer, E., & Tourangeau, R. (2009). Survey methodology (2nd ed.). Wiley.
Harter, R., Battaglia, M. P., Buskirk, T. D., Dillman, D. A., English, N., Fahimi, M., Frankel, M. R., Kennel, T., McMichael, J. P., McPhee, C. B., Montaquila, J., Yancey, T., & Zukerberg, A. L. (2016). Address-based sampling. American Association for Public Opinion Research.
Iannacchione, V. G. (2011). The changing role of address-based sampling in survey research. Public Opinion Quarterly, 75(3), 556–575. https://doi.org/10.1093/poq/nfr017
Iannacchione, V. G., Staab, J. M., & Redden, D. T. (2003). Evaluating the use of residential mailing addresses in a metropolitan household survey. Public Opinion Quarterly, 67(2), 202–210. https://doi.org/10.1086/374398
Kalton, G. (2009). Methods for oversampling rare subpopulations in social surveys. Survey Methodology, 35(2), 125–141.
Link, M. W., Battaglia, M. P., Frankel, M. R., Osborn, L., & Mokdad, A. H. (2008). A comparison of address-based sampling (ABS) versus random-digit dialing (RDD) for general population surveys. Public Opinion Quarterly, 72(1), 6–27. https://doi.org/10.1093/poq/nfn003
Lohr, S. L. (2021). Sampling: Design and analysis (3rd ed.). CRC Press. https://doi.org/10.1201/9780429298899
Lynn, P., & Taylor, B. (1995). On the bias and variance of samples of individuals: A comparison of the Electoral Registers and Postcode Address File as sampling frames. Journal of the Royal Statistical Society: Series D (The Statistician), 44(2), 173–194. https://doi.org/10.2307/2348443
McMichael, J. P., Ridenhour, J. L., & Shook-Sa, B. E. (2008). A robust procedure to supplement the coverage of address-based sampling frames for household surveys. In Proceedings of the Survey Research Methods Section (pp. 4329–4335). American Statistical Association.
Messer, B. L., & Dillman, D. A. (2011). Surveying the general public over the internet using address-based sampling and mail contact procedures. Public Opinion Quarterly, 75(3), 429–457. https://doi.org/10.1093/poq/nfr021
Olson, K., Stange, M., & Smyth, J. (2014). Assessing within-household selection methods in household mail surveys. Public Opinion Quarterly, 78(3), 656–678. https://doi.org/10.1093/poq/nfu022
Pasek, J., Jang, S. M., Cobb, C. L., Dennis, J. M., & Disogra, C. (2014). Can marketing data aid survey research? Examining accuracy and completeness in consumer-file data. Public Opinion Quarterly, 78(4), 889–916. https://doi.org/10.1093/poq/nfu043
Shook-Sa, B. E., Currivan, D. B., McMichael, J. P., & Iannacchione, V. G. (2013). Extending the coverage of address-based sampling frames beyond the USPS computerized delivery sequence file. Public Opinion Quarterly, 77(4), 994–1005. https://doi.org/10.1093/poq/nft041
Smyth, J. D., Dillman, D. A., Christian, L. M., & O'Neill, A. C. (2010). Using the internet to survey small towns and communities: Limitations and possibilities in the early 21st century. American Behavioral Scientist, 53(9), 1423–1448. https://doi.org/10.1177/0002764210361695
Tourangeau, R., Edwards, B., Johnson, T. P., Wolter, K. M., & Bates, N. (Eds.). (2014). Hard-to-survey populations. Cambridge University Press. https://doi.org/10.1017/CBO9781107628771
Valliant, R., Hubbard, F., Lee, S., & Chang, C. (2014). Efficient use of commercial lists in U.S. household sampling. Journal of Survey Statistics and Methodology, 2(2), 182–209. https://doi.org/10.1093/jssam/smu006