
Surveys · Sampling
The Role of Proxy Respondents in Household Surveys and Demographic Knowledge
In many household surveys, one person answers on behalf of others. These proxy reports make surveys cheaper and more complete, but they can be less accurate for some kinds of information. This article explains when proxies are used, what the evidence shows about their accuracy and how to use them well.
When an interviewer visits a household to collect information about everyone who lives there, it is rarely possible to speak to every member. Some are at work, some are too young, some are ill and some simply do not want to take part. Many surveys therefore accept answers from one household member about others. These are proxy reports, and the person giving them is a proxy respondent (Moore, 1988). Proxies are a routine part of many official household surveys, including labour force surveys, where one person commonly reports employment information for all adults in the household (U.S. Census Bureau, 2019).
Why proxies are used
Proxies serve several purposes. They reduce cost, since one interview can cover a whole household. They reduce unit nonresponse, because information can be collected about people who would otherwise be missed. And they allow surveys to include people who cannot answer for themselves, such as young children, people with severe illness or cognitive impairment, and older adults in care (Neumann et al., 2000).
How accurate are proxy reports?
Proxy reports are not always worse than self-reports, but their accuracy depends strongly on the kind of information requested. A review of the literature found mixed evidence, with proxies doing well on some topics and poorly on others (Moore, 1988). Figure 1 illustrates the general pattern.
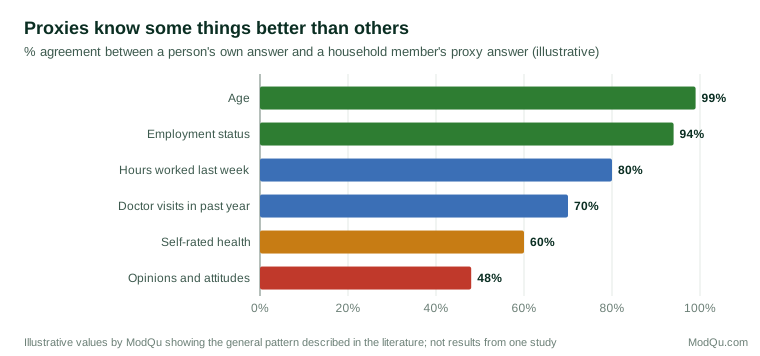
Proxies are usually accurate about observable, stable facts, such as age, sex, relationships in the household and whether someone has a job. They are less accurate about details and frequencies, such as hours worked, earnings or the number of times someone visited a doctor, which they may not have observed. They are least reliable for internal states, such as attitudes, feelings and subjective health, which only the person concerned can know directly (Blair et al., 1991; Sudman et al., 1996).
The cognitive processes behind self and proxy answers also differ. People answering about themselves can draw on memories of specific events. Proxies more often rely on general knowledge and estimation, and on assumptions about what the other person usually does (Blair et al., 1991; Tourangeau et al., 2000).
In health research, studies comparing patients with their proxies found reasonable agreement on observable functions, such as mobility, but larger differences on symptoms and psychological well-being (Magaziner et al., 1988). Proxies sometimes report more disability than the person themselves, particularly for less visible limitations (Todorov & Kirchner, 2000). Survey rules about who may answer can therefore change the results: an experiment in a health survey found that reports of health events differed depending on whether respondents answered for themselves or for others (Mathiowetz & Groves, 1985).
What affects proxy accuracy
Proxy accuracy is better when the proxy lives with the person, has frequent contact, is closely involved in the relevant matters and is answering about recent or important events. Spouses tend to be better proxies than other relatives. Accuracy is lower for older events, minor events and private matters (Moore, 1988; Neumann et al., 2000).
Proxies and demographic knowledge
Much of what is known about the composition of households, from the number of children to the employment of each adult, comes from surveys in which one person reports for everyone. This makes proxy reporting part of the foundation of demographic statistics. It also means that some patterns in the data may reflect who answered as much as what is true. Young men, for example, are often less available for interviews and so are more often reported by a parent or partner. If proxies under-report their hours of work or the details of their jobs, estimates for young men will be affected more than those for groups who usually answer for themselves (Moore, 1988).
Proxy reporting also affects the measurement of household relationships and living arrangements. A proxy may describe a household member's relationship or residence differently from how that person would, for example in the case of adult children who live partly at home or partners who stay some nights each week. Clear definitions and examples in the questionnaire reduce this problem.
Using proxies well
- Decide in advance which questions allow proxies. Factual household information can often be collected by proxy; attitudes and subjective measures should usually be self-reported or left missing.
- Choose the most knowledgeable proxy, for example the person who handles household finances for income questions.
- Record who answered for each person, so that analysts can compare self and proxy reports and adjust if necessary.
- Consider assisted interviews, in which a helper supports the respondent rather than answering for them. Assisted answers can differ from both self and proxy reports (Elliott et al., 2008).
- Analyse differences. Where proxy rates vary between groups, such as men and women or younger and older people, differences in results may partly reflect who answered.
An example
A household survey asks about each adult's job and earnings and about their satisfaction with work. In a third of cases, information about one adult is given by their partner. Analysis shows that proxy reports of employment status match administrative records almost as closely as self-reports, but proxy reports of earnings are more often rounded and slightly lower. The survey team keeps proxy answers for employment and earnings, flags them in the data file and recommends that analysts check whether results change when proxy cases are excluded. Satisfaction questions are not asked by proxy, and those values are left missing (illustrative example).
Conclusion
Proxy respondents allow household surveys to collect more complete information at lower cost and to include people who cannot answer themselves. Their reports are reliable for observable facts but less so for details, frequencies and inner states. Deciding which questions allow proxies, choosing knowledgeable proxies and recording who answered make proxy data a useful part of demographic knowledge rather than a hidden source of error (Groves et al., 2009).
References
Blair, J., Menon, G., & Bickart, B. (1991). Measurement effects in self vs. proxy response to survey questions: An information-processing perspective. In P. P. Biemer, R. M. Groves, L. E. Lyberg, N. A. Mathiowetz, & S. Sudman (Eds.), Measurement errors in surveys (pp. 145–166). Wiley.
Elliott, M. N., Beckett, M. K., Chong, K., Hambarsoomians, K., & Hays, R. D. (2008). How do proxy responses and proxy-assisted responses differ from what Medicare beneficiaries might have reported about their health care? Health Services Research, 43(3), 833–848. https://doi.org/10.1111/j.1475-6773.2007.00820.x
Groves, R. M., Fowler, F. J., Jr., Couper, M. P., Lepkowski, J. M., Singer, E., & Tourangeau, R. (2009). Survey methodology (2nd ed.). Wiley.
Magaziner, J., Simonsick, E. M., Kashner, T. M., & Hebel, J. R. (1988). Patient-proxy response comparability on measures of patient health and functional status. Journal of Clinical Epidemiology, 41(11), 1065–1074. https://doi.org/10.1016/0895-4356(88)90076-5
Mathiowetz, N. A., & Groves, R. M. (1985). The effects of respondent rules on health survey reports. American Journal of Public Health, 75(6), 639–644. https://doi.org/10.2105/AJPH.75.6.639
Moore, J. C. (1988). Self/proxy response status and survey response quality: A review of the literature. Journal of Official Statistics, 4(2), 155–172.
Neumann, P. J., Araki, S. S., & Gutterman, E. M. (2000). The use of proxy respondents in studies of older adults: Lessons, challenges, and opportunities. Journal of the American Geriatrics Society, 48(12), 1646–1654. https://doi.org/10.1111/j.1532-5415.2000.tb03877.x
Sudman, S., Bradburn, N. M., & Schwarz, N. (1996). Thinking about answers: The application of cognitive processes to survey methodology. Jossey-Bass.
Todorov, A., & Kirchner, C. (2000). Bias in proxies' reports of disability: Data from the National Health Interview Survey on Disability. American Journal of Public Health, 90(8), 1248–1253. https://doi.org/10.2105/AJPH.90.8.1248
Tourangeau, R., Rips, L. J., & Rasinski, K. (2000). The psychology of survey response. Cambridge University Press. https://doi.org/10.1017/CBO9780511819322
U.S. Census Bureau. (2019). Current Population Survey design and methodology (Technical Paper 77). U.S. Department of Commerce.