
Surveys · Sampling
The Impact of Algorithmic Survey Distribution on Demographic Knowledge Generation
When survey invitations are distributed through advertising platforms and recommendation systems, algorithms decide who sees them. This article explains how that shapes the demographic make-up of samples and what researchers can do about it.
Survey invitations are increasingly delivered not by researchers choosing whom to contact, but by algorithms. Social media advertising, search advertising and content recommendation systems decide which users see an invitation, when and how often. Researchers can set a target audience, but the platform's delivery system makes the final choice, usually to maximise clicks or minimise cost (Schneider & Harknett, 2022). This has consequences for who ends up in a sample and therefore for the demographic knowledge that surveys produce.
How algorithms shape samples
Advertising platforms optimise delivery towards people they predict are most likely to respond. Even when an advertiser asks for a broad audience, delivery can be skewed. Studies of advertising delivery have shown that identical advertisements targeted at the same audience were shown to very different shares of men and women, or of different racial groups, depending on the content and images used and on the platform's predictions of relevance (Ali et al., 2019). Another study found that an advertisement for careers in science and technology was shown to fewer women than men, not because of explicit targeting, but because the cost of reaching younger women was higher and the algorithm favoured cheaper impressions (Lambrecht & Tucker, 2019).
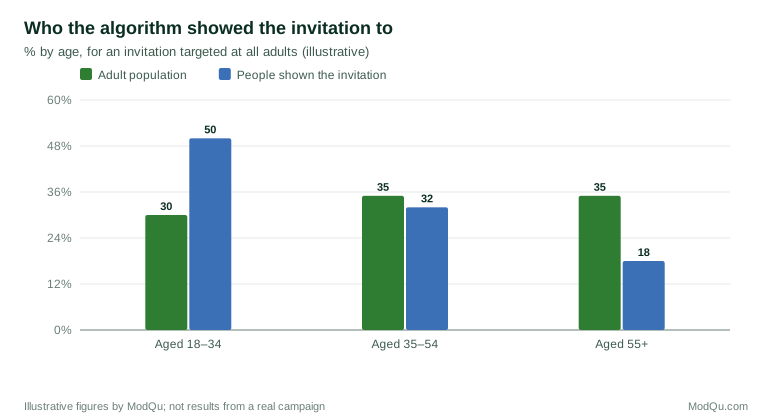
For surveys, this means the sample can differ from the intended population before anyone has decided whether to take part. Figure 1 illustrates how delivery can over-represent younger users.
Effects on demographic knowledge
When delivery is skewed, three problems follow. First, groups the algorithm favours are over-represented, and groups it neglects may be too few to analyse. Second, within each demographic group, the people shown the invitation are those the algorithm judges most likely to engage, who may differ from others in the same group. Third, the skew can change over time as the platform's models and costs change, making comparisons between survey waves less reliable (Schneider & Harknett, 2022). Because researchers cannot see how the algorithm works, these effects are hard to detect without careful checks.
Why the problem is hard to see
In traditional surveys, researchers know whom they contacted and can compare respondents with nonrespondents. With algorithmic distribution, the first selection step happens inside a system the researcher does not control. Platforms report how many people saw an advertisement and some breakdowns by age, sex and location, but not the full set of characteristics used to decide delivery. The researcher sees only the final sample. A sample that looks balanced on age and sex, because quotas were applied, may still be skewed on characteristics the platform used, such as interests, online activity or past responses to advertisements. These characteristics can be related to the very attitudes and behaviours a survey measures.
Delivery skew also interacts with self-selection. People shown an invitation decide whether to click, and their decisions feed back into the algorithm, which learns to show the invitation to more people like those who clicked. Over the course of a campaign, the sample can drift towards whatever kind of person responded first.
What researchers can do
Several strategies can reduce algorithmic skew:
- Run separate campaigns for each demographic cell, such as age by sex, each with its own budget, so the algorithm cannot shift spending between groups. This approach has been used to fill quota samples through social media advertising (Zhang et al., 2020).
- Monitor delivery and recruitment daily by demographic group, and adjust budgets when some groups lag.
- Use neutral images and wording, since the content of an invitation influences whom the algorithm shows it to (Ali et al., 2019).
- Weight results to population totals, and include variables related to platform use and engagement where possible (Baker et al., 2013).
- Compare recruitment channels, since different platforms produce different samples (Antoun et al., 2016; Whitaker et al., 2017).
- Report the platform, targeting settings and delivery statistics, so readers can judge possible bias.
An example
A researcher recruits adults for a survey on housing through social media advertising, targeting all adults in a region. After three days, three quarters of completed responses come from people under 40. The researcher pauses the single campaign and replaces it with six campaigns, one for each combination of three age groups and two sexes, each with a fixed daily budget. The age profile of new responses moves close to the population profile, and final results are weighted to correct the remaining difference (illustrative example).
Conclusion
Algorithmic distribution adds a hidden layer of selection to online surveys. Platforms decide who sees an invitation according to their own goals, which can skew samples by age, sex and other characteristics before respondents make any choice. Controlling delivery through separate campaigns, monitoring and weighting, and reporting how invitations were distributed, help keep demographic knowledge from becoming a by-product of advertising algorithms.
References
Ali, M., Sapiezynski, P., Bogen, M., Korolova, A., Mislove, A., & Rieke, A. (2019). Discrimination through optimization: How Facebook's ad delivery can lead to biased outcomes. Proceedings of the ACM on Human-Computer Interaction, 3(CSCW), Article 199. https://doi.org/10.1145/3359301
Antoun, C., Zhang, C., Conrad, F. G., & Schober, M. F. (2016). Comparisons of online recruitment strategies for convenience samples: Craigslist, Google AdWords, Facebook, and Amazon Mechanical Turk. Field Methods, 28(3), 231–246. https://doi.org/10.1177/1525822X15603149
Baker, R., Brick, J. M., Bates, N. A., Battaglia, M., Couper, M. P., Dever, J. A., Gile, K. J., & Tourangeau, R. (2013). Summary report of the AAPOR task force on non-probability sampling. Journal of Survey Statistics and Methodology, 1(2), 90–143. https://doi.org/10.1093/jssam/smt008
Lambrecht, A., & Tucker, C. (2019). Algorithmic bias? An empirical study of apparent gender-based discrimination in the display of STEM career ads. Management Science, 65(7), 2966–2981. https://doi.org/10.1287/mnsc.2018.3093
Schneider, D., & Harknett, K. (2022). What's to like? Facebook as a tool for survey data collection. Sociological Methods & Research, 51(1), 108–140. https://doi.org/10.1177/0049124119882477
Whitaker, C., Stevelink, S., & Fear, N. (2017). The use of Facebook in recruiting participants for health research purposes: A systematic review. Journal of Medical Internet Research, 19(8), e290. https://doi.org/10.2196/jmir.7071
Zhang, B., Mildenberger, M., Howe, P. D., Marlon, J., Rosenthal, S. A., & Leiserowitz, A. (2020). Quota sampling using Facebook advertisements. Political Science Research and Methods, 8(3), 558–564. https://doi.org/10.1017/psrm.2018.49