
Surveys · Sampling
Multi-Frame Sampling Designs for Improved Coverage of Target Populations
No single list covers every member of most populations. Multi-frame designs draw samples from two or more overlapping frames and combine them, improving coverage and often reducing cost. This article explains how they work, how the overlap is handled, where they are used and what can go wrong.
Every probability sample starts with a sampling frame: a list, a map or another device that identifies the members of the population so that they can be selected. In theory, the frame and the target population match exactly. In practice, they rarely do. A register of businesses misses new firms and sole traders. A list of landline telephone numbers misses households that use only mobile phones. An association's membership list covers only those who chose to join. The members left out are often different from those included, so a sample drawn from one incomplete frame can give biased results (Groves et al., 2009; Lohr, 2021).
One answer is to use more than one frame. A multi-frame design selects independent samples from two or more frames that together cover the population better than any one of them alone, and then combines the samples into a single set of estimates. The idea was set out by Hartley (1962, 1974) and has since been developed into a substantial body of theory and practice (Lohr, 2009). This article explains the basic structure of multi-frame designs, the problem of overlap, the main estimators, common applications and the practical issues that determine whether such a design improves or harms the quality of the knowledge it produces.
Why one frame is often not enough
Frames are built for purposes other than surveys. Business registers serve tax administration. Telephone directories serve subscribers. Membership lists serve associations. Each has its own rules about who is included, and each reflects how its owner reaches people. As a result, frames tend to have two kinds of weakness. Some are complete but costly: an area frame, made up of geographic units such as blocks or land segments, can in principle cover everyone, but finding members of the population within each area requires expensive fieldwork. Others are cheap but incomplete: a list of known members can be sampled and contacted at low cost, but it leaves out part of the population (Kott & Vogel, 1995).
A multi-frame design combines the strengths of both. A typical arrangement pairs an incomplete but efficient list frame with a complete but expensive frame. The list frame provides many interviews at low cost, while the complete frame ensures that the people missing from the list still have a chance of selection. Hartley (1962) showed that, with the right allocation of the sample between the two frames, such a design can achieve a given precision at lower cost than a single-frame design, or better precision at the same cost.
Multi-frame designs also help when the population of interest is rare. A general population frame covers rare groups, but screening a large general sample to find them is expensive. A specialised list, such as a register of people with a particular condition or a directory of firms in a particular industry, contains a high concentration of the group but misses some members. Combining the two gives both efficiency and coverage (Kalton & Anderson, 1986; Kalton, 2009).
The structure of a dual-frame design
The simplest case uses two frames, labelled A and B. Together they divide the population into three domains: members found only on frame A (domain a), members found only on frame B (domain b) and members found on both (domain ab). Members found on neither frame are not covered by the design at all, which is why the frames together should cover the whole population, or as close to it as possible (Hartley, 1962; Lohr, 2009). Figure 1 shows the three domains for an example used throughout this article.
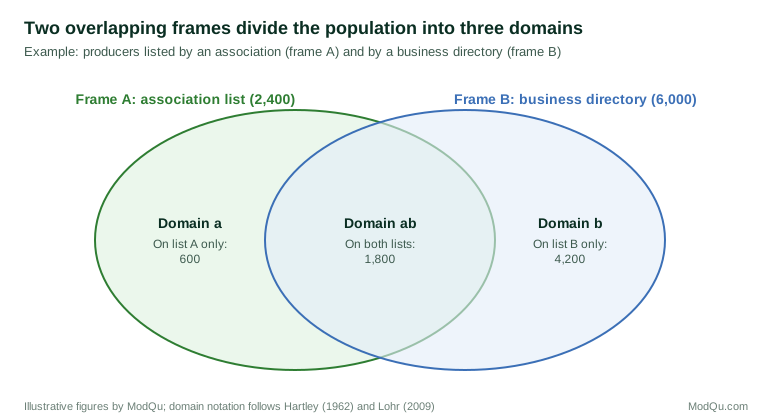
In the example, a researcher wants to survey specialty food producers in a region. Frame A is an industry association's membership list with 2,400 producers. Frame B is a commercial business directory with 6,000 producers. The two lists overlap: 1,800 producers appear on both. The population therefore contains 600 + 1,800 + 4,200 = 6,600 producers, assuming that every producer is on at least one list.
A sample is drawn independently from each frame. Members of domain ab can be selected from either frame, so they have two chances of selection. If the two samples are simply combined and weighted as though each were the only sample, the overlap is counted twice. Figure 2 shows the effect on a simple count.
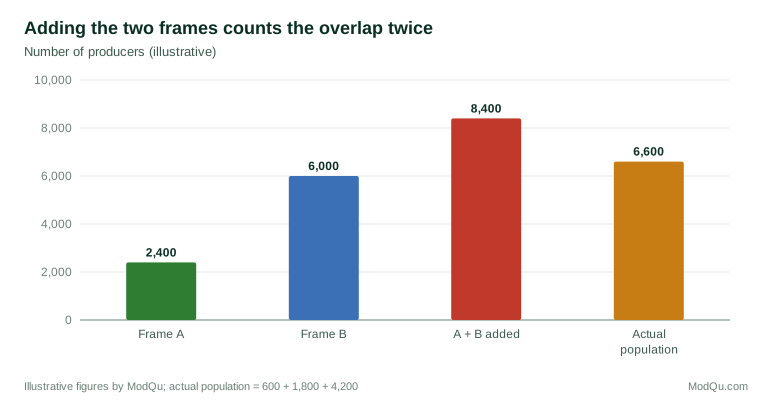
The same double counting distorts any total or mean. If producers on both lists are larger or more established than others, which is likely when one list is an association's membership, a naive combination would also overstate the typical size of a producer. Handling the overlap correctly is the central technical task of a multi-frame design (Lohr, 2009).
Estimators for the overlap
Several estimators have been proposed. They differ in how they treat members of the overlap domain and in how much information they require.
Hartley's estimator
Hartley (1962, 1974) proposed estimating each domain separately and combining the two estimates of the overlap. Frame A gives estimates for domains a and ab; frame B gives estimates for domains b and ab. The population total is estimated as the sum of the estimate for domain a, the estimate for domain b and a weighted average of the two estimates for domain ab. The weight, often written as θ (theta), lies between 0 and 1 and determines how much each sample contributes to the overlap estimate. Hartley chose θ to minimise the variance of the estimated total, which gives more weight to the frame whose sample estimates the overlap more precisely.
Choosing θ to minimise variance has a drawback: the optimal value depends on the variable being estimated. A survey with many questions would then have a different θ, and therefore a different set of weights, for each variable. This is inconvenient for analysts and can lead to estimates that are not consistent with each other, for example a total for men and a total for women that do not add up to the overall total (Lohr & Rao, 2000).
Fuller and Burmeister's estimator
Fuller and Burmeister (1972) extended Hartley's approach by also using the difference between the two independent estimates of the overlap domain. Because both samples estimate the same quantity, their difference carries information that can improve precision. Their estimator is often more efficient than Hartley's but shares the problem of variable-specific weights.
Single-frame estimators
A simpler approach treats the combined sample as if it came from a single frame and adjusts each member's weight for the number of frames on which they appear. Bankier (1986) and Kalton and Anderson (1986) developed estimators of this kind. A member of domain ab has two chances of selection, so the selection probabilities from the two frames are added, and the weight is based on the combined probability. One set of weights then applies to every variable, which makes analysis straightforward. Single-frame estimators require knowing, for every sampled unit, whether it is also on the other frame and what its selection probability would have been there.
Pseudo-maximum likelihood and other approaches
Skinner and Rao (1996) proposed a pseudo-maximum likelihood estimator that works with complex sample designs, such as stratified and clustered samples within each frame, and produces a single set of weights for all variables. Skinner (1991) showed how raking, in which weights are adjusted iteratively to match known totals, can be used in multiple-frame surveys. Lohr and Rao (2000, 2006) compared estimators and extended them to designs with more than two frames, and Rao and Wu (2010) developed empirical likelihood methods for multiple-frame surveys. Lohr and Rao (2000) found that the pseudo-maximum likelihood estimator and the Fuller–Burmeister estimator generally performed well, while simpler estimators remained useful when design information was limited.
Multiplicity estimators
A further approach does not need to know which domain each member belongs to in advance, only how many of the frames include them. Mecatti (2007) proposed a multiplicity estimator in which each sampled unit's weight is divided by the number of frames on which it appears. A unit on two frames counts half as much from each sample. Singh and Mecatti (2011) showed that many multi-frame estimators can be seen as special cases of a generalised form of this approach. Multiplicity estimators are simple to compute and can be applied with any number of frames.
Knowing who is on which frame
Every estimator depends on correctly identifying which frames include each sampled member. This is easy when the frames can be matched directly, for example when both are lists with unique identifiers such as business numbers. It is harder when the frames use different identifiers or cannot be shared. In those cases, frame membership is usually determined by asking respondents. A household reached on a mobile phone can be asked whether it also has a landline; a producer selected from a directory can be asked whether it belongs to the association.
Answers to such questions are not always correct. Respondents may not know whether they appear on a list, or may misunderstand the question. Misclassifying a unit's domain changes its weight and can bias estimates (Lohr, 2011). Matching records directly is preferable where possible, and the wording of membership questions deserves careful testing. Lohr (2011) also noted that some designs screen out overlap members from one frame: for example, only units not on frame A are retained from the frame B sample. This simplifies estimation, since each unit can be selected from only one frame, but it wastes interviews and depends entirely on correct screening.
Applications
Agriculture and business surveys
Multi-frame designs were first used widely in agricultural surveys. Statistical agencies combined a list frame of known farms, which allowed efficient sampling of large operations, with an area frame of land segments that covered every farm, including those missing from the list (Hartley, 1974; Kott & Vogel, 1995). The list frame provided precise estimates for large farms that account for most production, while the area frame covered small and new farms.
Business surveys face similar problems. Business registers are updated with a delay, so new firms are missing and closed firms remain listed. Commercial directories, association lists and online listings each cover different parts of the business population. Combining frames can improve coverage of small and new firms, which are often the least well covered by any single source (Kott & Vogel, 1995). For research that generates knowledge about markets and industries, this matters: an estimate based only on established, registered firms may describe a market that looks older and more stable than it is.
Telephone surveys
Dual-frame designs became common in telephone surveys when mobile phones spread. Samples drawn only from landline numbers missed a growing share of households, especially younger and lower-income adults (Blumberg & Luke, 2007). Survey organisations responded by combining a landline sample with a mobile phone sample (American Association for Public Opinion Research [AAPOR], 2010). Households with both kinds of telephone form the overlap domain. Respondents were asked about their telephone use to determine their domain, and estimators such as those described above were used to combine the samples.
Experience with dual-frame telephone surveys showed that nonsampling errors can differ between frames. People reached on mobile phones and on landlines responded at different rates, and members of the overlap domain reached through one frame were not always similar to those reached through the other (Brick et al., 2006). Brick et al. (2011) found that such differences in nonresponse and measurement between frames can bias dual-frame estimates, and that the choice of θ can affect how large this bias is.
Rare and hard-to-reach populations
Multi-frame designs are widely used to study rare groups. Kalton and Anderson (1986) described combining a general population sample with a sample from a special list as one of the main strategies for sampling rare populations. In health research, Metcalf and Scott (2009) discussed surveys that combine a population frame with lists such as patient registers to obtain enough cases of particular conditions. Iachan and Dennis (1993) developed a multiple-frame approach for estimating the size and characteristics of homeless and transient people, combining frames such as shelters, meal services and street locations. People who use more than one service appear on more than one frame, so the multiplicity of each person had to be established.
Similar problems arise in studies of mobile or seasonal populations, where each frame captures people at a different place or time. Haines and Pollock (1998) showed how multiple frames can be combined to estimate the size and totals of such populations.
Designing a multi-frame survey
A multi-frame design involves several decisions beyond those of a single-frame survey.
Choosing the frames. The frames should together cover the target population as completely as possible. Each frame should be assessed for coverage, duplication within the frame, ineligible entries and the information it carries for stratification and contact (Lohr, 2009).
Allocating the sample. The total sample must be divided between the frames. Hartley (1962) showed how to find the allocation that minimises variance for a fixed cost, given the cost per interview in each frame and the variability within each domain. In general, more sample should go to the frame that is cheaper to interview, as long as the overlap and the unique domains are estimated with adequate precision. Lepkowski and Groves (1986) extended this reasoning to mean squared error, which includes bias as well as variance. Groves and Lepkowski (1985) showed that when the frames also use different data collection modes, such as an area frame interviewed face to face and a telephone list, differences in measurement between modes should enter the design decision.
Stratifying within frames. Each frame can be stratified using information available on it. Skinner et al. (1994) showed that using multiple frames can also be a way to achieve stratification on several variables when no single frame carries all of them.
Planning for domain identification. The questionnaire must collect the information needed to assign each respondent to a domain. Where frames are lists, matching should be planned before fieldwork begins (Lohr, 2011).
Choosing the estimator. If a single set of weights is needed for many variables, a single-frame, pseudo-maximum likelihood or multiplicity estimator is usually more practical than Hartley's variable-specific approach (Lohr & Rao, 2000; Lohr, 2009). Software is available: for example, the Frames2 package for R implements several dual-frame estimators (Arcos et al., 2015).
An example
Returning to the producers in Figure 1, suppose the researcher has a budget for 600 interviews. Interviews from the association list cost less, because contact details are accurate and members are used to responding to association requests. Interviews from the business directory cost more, because many listings are out of date. The researcher draws 300 producers from each frame.
Each respondent is asked whether they belong to the association and whether they are listed in the directory, and the answers are checked against the two lists by matching business names and addresses. In the association sample, three quarters of respondents are also in the directory (domain ab), and one quarter are not (domain a). In the directory sample, 30 per cent are association members (domain ab) and 70 per cent are not (domain b).
If the two samples were added together without adjustment, producers on both lists would be counted twice, and their characteristics would be over-represented. Instead, the researcher uses a single-frame estimator: each respondent's weight is based on the sum of their chances of selection from the two frames. Members of domain ab receive smaller weights than they would in either sample alone. The resulting estimates refer to all 6,600 producers, not 8,400. Comparing results by domain also shows that producers found only in the directory are smaller and newer on average than association members, a difference that a survey of the association list alone would have missed (illustrative example).
Common problems
Multi-frame designs bring their own sources of error, and these need to be watched as closely as the coverage problems the design is meant to solve.
- Uncovered members remain. If some members of the population are on none of the frames, the design does not cover them. Adding frames reduces this problem but does not remove it.
- Domain misclassification. Incorrect answers to membership questions, or errors in matching, put units in the wrong domain and give them the wrong weights (Lohr, 2011).
- Differences between frames in nonresponse and measurement. Members of the overlap reached through different frames may respond at different rates and answer differently, particularly when frames are linked to different modes (Brick et al., 2006, 2011).
- Duplication within frames. A frame may list the same unit more than once, which increases its chance of selection. Duplicates should be removed or their multiplicity recorded.
- Complexity of variance estimation. Combining samples requires variance estimation that reflects both designs. Replication methods or specialised software are usually needed (Lohr & Rao, 2006; Arcos et al., 2015).
The wider context
Multi-frame thinking has become more important as single high-coverage frames have become harder to use. Response rates to traditional telephone and face-to-face surveys have fallen, and no single frame now offers both complete coverage and low cost for many populations (Brick, 2011). Researchers increasingly combine address lists, telephone samples, administrative registers, business directories and specialised lists. The theory developed for multi-frame surveys provides a principled way to combine these sources, provided that each is a probability sample from a defined frame and that the overlap can be identified. The same reasoning about overlap and multiplicity also informs efforts to combine probability samples with other data sources, although those combinations raise additional problems because not every source has known selection probabilities (Lohr, 2021).
Conclusion
Multi-frame sampling designs address a basic weakness of survey research: no single list covers most populations completely. By drawing samples from two or more overlapping frames, researchers can improve coverage, reach rare groups more efficiently and reduce cost. The price is added complexity. The overlap between frames must be identified and handled with an appropriate estimator, the sample must be allocated between frames with care, and differences in nonresponse and measurement between frames must be monitored. When these tasks are done well, a multi-frame design produces estimates that describe the whole target population, not only the part that happens to appear on the most convenient list.
References
American Association for Public Opinion Research. (2010). New considerations for survey researchers when planning and conducting RDD telephone surveys in the U.S. with respondents reached via cell phone numbers. AAPOR Cell Phone Task Force.
Arcos, A., Molina, D., Ranalli, M. G., & Rueda, M. del M. (2015). Frames2: A package for estimation in dual frame surveys. The R Journal, 7(1), 52–72. https://doi.org/10.32614/RJ-2015-005
Bankier, M. D. (1986). Estimators based on several stratified samples with applications to multiple frame surveys. Journal of the American Statistical Association, 81(396), 1074–1079. https://doi.org/10.1080/01621459.1986.10478376
Blumberg, S. J., & Luke, J. V. (2007). Coverage bias in traditional telephone surveys of low-income and young adults. Public Opinion Quarterly, 71(5), 734–749. https://doi.org/10.1093/poq/nfm047
Brick, J. M. (2011). The future of survey sampling. Public Opinion Quarterly, 75(5), 872–888. https://doi.org/10.1093/poq/nfr045
Brick, J. M., Cervantes, I. F., Lee, S., & Norman, G. (2011). Nonsampling errors in dual frame telephone surveys. Survey Methodology, 37(1), 1–12.
Brick, J. M., Dipko, S., Presser, S., Tucker, C., & Yuan, Y. (2006). Nonresponse bias in a dual frame sample of cell and landline numbers. Public Opinion Quarterly, 70(5), 780–793. https://doi.org/10.1093/poq/nfl031
Fuller, W. A., & Burmeister, L. F. (1972). Estimators for samples selected from two overlapping frames. In Proceedings of the Social Statistics Section (pp. 245–249). American Statistical Association.
Groves, R. M., & Lepkowski, J. M. (1985). Dual frame, mixed mode survey designs. Journal of Official Statistics, 1(3), 263–286.
Groves, R. M., Fowler, F. J., Jr., Couper, M. P., Lepkowski, J. M., Singer, E., & Tourangeau, R. (2009). Survey methodology (2nd ed.). Wiley.
Haines, D. E., & Pollock, K. H. (1998). Combining multiple frames to estimate population size and totals. Survey Methodology, 24(1), 79–88.
Hartley, H. O. (1962). Multiple frame surveys. In Proceedings of the Social Statistics Section (pp. 203–206). American Statistical Association.
Hartley, H. O. (1974). Multiple frame methodology and selected applications. Sankhyā: The Indian Journal of Statistics, Series C, 36(3), 99–118.
Iachan, R., & Dennis, M. L. (1993). A multiple frame approach to sampling the homeless and transient population. Journal of Official Statistics, 9(4), 747–764.
Kalton, G., & Anderson, D. W. (1986). Sampling rare populations. Journal of the Royal Statistical Society: Series A (General), 149(1), 65–82. https://doi.org/10.2307/2981886
Kalton, G. (2009). Methods for oversampling rare subpopulations in social surveys. Survey Methodology, 35(2), 125–141.
Kott, P. S., & Vogel, F. A. (1995). Multiple-frame business surveys. In B. G. Cox, D. A. Binder, B. N. Chinnappa, A. Christianson, M. J. Colledge, & P. S. Kott (Eds.), Business survey methods (pp. 185–203). Wiley. https://doi.org/10.1002/9781118150504.ch11
Lepkowski, J. M., & Groves, R. M. (1986). A mean squared error model for dual frame, mixed mode survey design. Journal of the American Statistical Association, 81(396), 930–937.
Lohr, S., & Rao, J. N. K. (2006). Estimation in multiple-frame surveys. Journal of the American Statistical Association, 101(475), 1019–1030. https://doi.org/10.1198/016214506000000195
Lohr, S. L., & Rao, J. N. K. (2000). Inference from dual frame surveys. Journal of the American Statistical Association, 95(449), 271–280. https://doi.org/10.1080/01621459.2000.10473920
Lohr, S. L. (2009). Multiple-frame surveys. In D. Pfeffermann & C. R. Rao (Eds.), Handbook of statistics: Vol. 29A. Sample surveys: Design, methods and applications (pp. 71–88). Elsevier. https://doi.org/10.1016/S0169-7161(08)00004-5
Lohr, S. L. (2011). Alternative survey sample designs: Sampling with multiple overlapping frames. Survey Methodology, 37(2), 197–213.
Lohr, S. L. (2021). Sampling: Design and analysis (3rd ed.). CRC Press. https://doi.org/10.1201/9780429298899
Mecatti, F. (2007). A single frame multiplicity estimator for multiple frame surveys. Survey Methodology, 33(2), 151–157.
Metcalf, P., & Scott, A. (2009). Using multiple frames in health surveys. Statistics in Medicine, 28(10), 1512–1523. https://doi.org/10.1002/sim.3566
Rao, J. N. K., & Wu, C. (2010). Pseudo-empirical likelihood inference for multiple frame surveys. Journal of the American Statistical Association, 105(492), 1494–1503. https://doi.org/10.1198/jasa.2010.tm09494
Singh, A. C., & Mecatti, F. (2011). Generalized multiplicity-adjusted Horvitz-Thompson estimation as a unified approach to multiple frame surveys. Journal of Official Statistics, 27(4), 633–650.
Skinner, C. J., & Rao, J. N. K. (1996). Estimation in dual frame surveys with complex designs. Journal of the American Statistical Association, 91(433), 349–356. https://doi.org/10.1080/01621459.1996.10476695
Skinner, C. J. (1991). On the efficiency of raking ratio estimation for multiple frame surveys. Journal of the American Statistical Association, 86(415), 779–784. https://doi.org/10.1080/01621459.1991.10475109
Skinner, C. J., Holmes, D. J., & Holt, D. (1994). Multiple frame sampling for multivariate stratification. International Statistical Review, 62(3), 333–347. https://doi.org/10.2307/1403765