
Surveys · Sampling
Hybrid Probability-Nonprobability Designs for Cost-Efficient Knowledge Generation
Probability samples support sound inference but are expensive. Nonprobability samples are cheap but can be biased. Hybrid designs combine the two, using a small probability sample to correct or strengthen a larger nonprobability sample. This article explains how they work, the main methods and the assumptions they depend on.
Survey researchers face a persistent trade-off. Probability samples, in which every member of the population has a known chance of selection, provide a sound basis for estimating population values and their margins of error. They have become more expensive as response rates have fallen (Brick, 2011). Nonprobability samples, such as opt-in online panels, can deliver thousands of responses quickly and cheaply, but the people who join them are not a random selection of the population, and their results can be biased in ways that are hard to predict (Baker et al., 2013; Cornesse et al., 2020).
A hybrid design uses both. A relatively small probability sample provides an anchor for inference, and a larger nonprobability sample adds detail and precision at low cost. Statistical methods then combine the two so that the final estimates draw on the strengths of each (Elliott & Valliant, 2017; Yang & Kim, 2020). This article explains why hybrid designs are attractive, the main ways of combining samples, the assumptions behind them and how to judge whether a hybrid design is producing trustworthy knowledge.
Why combine the two?
Studies comparing probability and nonprobability samples have found that nonprobability samples are, on average, less accurate when measured against known population values, and that their errors vary more from one sample to another (Yeager et al., 2011; Cornesse et al., 2020). Weighting nonprobability samples to demographic totals reduces some of this error but often not all of it (Mercer et al., 2018). At the same time, low response rates mean that many probability samples also depend on modelling assumptions, and some studies have found smaller differences between low-response probability samples and well-managed nonprobability samples than earlier comparisons suggested (Dutwin & Buskirk, 2017).
A hybrid design responds to both facts. The probability sample is too small to give precise estimates for detailed subgroups but provides a reference that is free of the self-selection affecting the nonprobability sample. The nonprobability sample is large enough for detailed analysis but needs an external reference to correct its selection. Combining them can produce estimates that are less biased than the nonprobability sample alone and more precise than the probability sample alone, at a lower total cost than a large probability sample (Elliott & Valliant, 2017; Wiśniowski et al., 2020).
Methods for combining samples
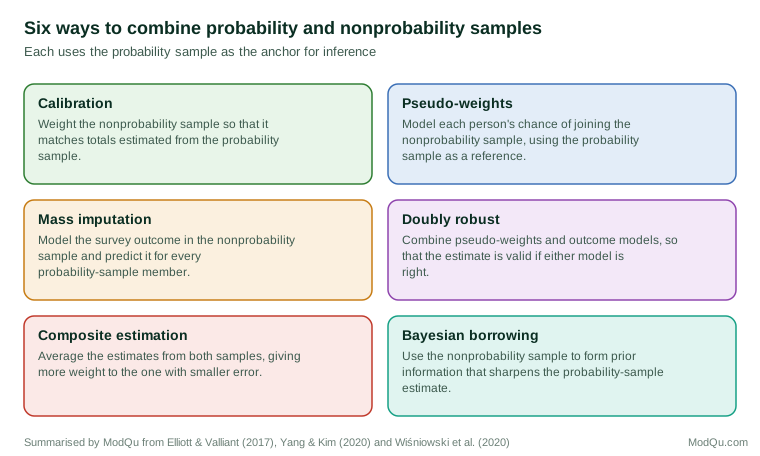
Figure 1 summarises six broad approaches. They differ in how they use the probability sample and in the assumptions they make.
Calibration to the probability sample
The simplest approach weights the nonprobability sample so that its distribution matches totals estimated from the probability sample. Unlike ordinary weighting to census totals, the probability sample can supply totals for variables that no census measures, such as internet use, political interest or attitudes related to the survey topic. DiSogra et al. (2011) proposed calibrating opt-in samples to a probability panel using variables that distinguish early adopters of technology, on the grounds that such people are over-represented in online samples. Calibration works when the variables used capture the reasons people joined the nonprobability sample (Kalton & Flores-Cervantes, 2003).
Propensity pseudo-weights
A second approach combines the two samples and models the probability that each person belongs to the nonprobability sample rather than the probability sample, given their characteristics. The inverse of this estimated propensity, adjusted for the probability sample's design weights, gives a pseudo-weight for each nonprobability respondent (Lee, 2006; Lee & Valliant, 2009; Valliant & Dever, 2011). Schonlau et al. (2009) found that propensity adjustment reduced bias in a web survey but did not remove it, and that it worked best when the model included attitudinal and behavioural variables, not only demographics. Elliott and Valliant (2017) set out the conditions under which such quasi-randomisation methods give valid estimates.
Mass imputation
A third approach models the survey outcome rather than the selection. Using the nonprobability sample, the researcher fits a model that predicts the outcome from variables measured in both samples. The model is then used to predict the outcome for every member of the probability sample, and the probability sample's design weights produce the estimate. This is called mass imputation (Kim et al., 2021). It works when the outcome model is correct and applies equally to people in and out of the nonprobability sample.
Doubly robust estimation
Doubly robust estimators combine pseudo-weights and outcome models. They give valid estimates if either the selection model or the outcome model is correctly specified, which provides some protection against model error (Chen et al., 2020). This property has made them a focus of recent research on data integration (Yang & Kim, 2020; Rao, 2021).
Composite estimation
When both samples measure the outcome directly, the two estimates can be averaged. A composite estimator gives more weight to the estimate with the smaller error. Because the nonprobability estimate may be biased, its error should include an allowance for bias, not only its variance. Estimating that bias usually requires comparing the two samples on variables measured in both (Elliott & Valliant, 2017).
Bayesian borrowing
Bayesian methods treat the nonprobability sample as a source of prior information. Sakshaug et al. (2019) and Wiśniowski et al. (2020) showed that using nonprobability data to form priors for estimates from a small probability sample can reduce variance and mean squared error, while the probability sample protects against the nonprobability sample's bias. When the two samples disagree strongly, the approach gives more weight to the probability sample.
Assumptions that matter
Every hybrid method rests on assumptions, and the quality of the resulting knowledge depends on whether they hold.
Common variables. The two samples must share variables that explain why people are in the nonprobability sample and that are related to the outcomes. If the reasons for joining an online panel are related to the outcome in ways that the shared variables do not capture, no method removes the bias (Mercer et al., 2017).
Comparable measurement. The samples must measure the shared variables in the same way. If the probability sample is interviewed by telephone and the nonprobability sample answers online, differences in answers may reflect mode rather than selection. Using the same mode and wording in both samples reduces this risk.
Overlap. For each kind of person in the population, there must be some people in the nonprobability sample. If an opt-in panel contains almost no older adults without university degrees, it cannot represent them however it is weighted.
A sound probability sample. The hybrid design inherits the coverage and nonresponse errors of the probability sample. A probability sample with low response is still a better anchor than none, but its own biases pass into the combined estimate (Beaumont, 2020).
Cost and precision
The case for hybrid designs is largely economic. Figure 2 compares the budget needed for a given margin of error under three designs in an illustrative example.
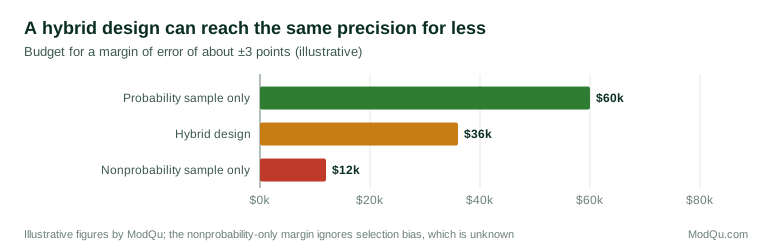
The nonprobability sample alone is cheapest, but its stated margin of error describes only random variation and ignores the bias from self-selection, which may be larger. The hybrid design costs more but provides an estimate whose error can be assessed against a probability-based reference. How much a hybrid design saves depends on how closely the two samples agree after adjustment: the more information the nonprobability sample adds, the smaller the probability sample can be (Sakshaug et al., 2019).
An example
A research team wants to measure the share of small-business owners who plan to adopt a new accounting standard, with separate estimates for 12 industries. A probability sample of 400 owners, drawn from a business register and interviewed online, is affordable but too small for industry estimates. An opt-in panel can supply 3,000 owners within a week. Both samples answer the same questionnaire, which includes business size, age of business, region, industry and questions about digital tool use.
The team fits a propensity model to estimate pseudo-weights for the panel respondents and an outcome model for planned adoption. It uses a doubly robust estimator to combine them. Before weighting, the panel shows a higher planned adoption rate than the probability sample, 48 per cent compared with 39 per cent, because panel members use more digital tools. After adjustment, the combined estimate is 40 per cent, close to the probability sample but with a much smaller margin of error, and industry estimates are now precise enough to report (illustrative example).
Planning a hybrid design
Hybrid designs work best when they are planned as a whole, not assembled after the fact. Several decisions shape their quality.
Size of the probability sample. The probability sample must be large enough to estimate the adjustment models and to detect meaningful differences between the samples. A few hundred cases is often the minimum for general population work, more when many subgroups matter (Wiśniowski et al., 2020).
Choice of linking variables. Both questionnaires should include variables chosen because they are likely to explain why people join the nonprobability sample: internet use, time spent online, interest in the topic, past survey participation and attitudes known to differ between panel members and others. Demographic variables alone are rarely enough (Schonlau et al., 2009; Mercer et al., 2018).
Same questionnaire and mode. Fielding the same questionnaire in the same mode in both samples keeps differences in measurement from being mistaken for differences in selection.
Timing. Both samples should be collected over the same period, so that changes in opinion or behaviour over time do not appear as differences between samples.
Benchmarks. Including a few questions with known population values, such as items from an official survey, allows the team to check whether the combined estimates are accurate (Yeager et al., 2011).
Judging a hybrid design
Researchers and readers can judge hybrid designs by asking a few questions (Baker et al., 2013; Cornesse et al., 2020):
- Was the probability sample drawn from a well-defined frame, and what was its response rate?
- Which variables were used to link the samples, and why are they likely to explain selection into the nonprobability sample?
- Do the samples agree after adjustment on variables that were not used in the adjustment?
- Are results reported for the probability sample alone, so that readers can see how much the nonprobability sample changed them?
- Is the method of variance estimation stated, and does it reflect the uncertainty from both samples and the models?
Conclusion
Hybrid probability–nonprobability designs offer a practical way to generate detailed knowledge at moderate cost. A small probability sample provides an anchor for inference, and a large nonprobability sample provides detail and precision. Calibration, pseudo-weights, mass imputation, doubly robust estimators, composite estimators and Bayesian methods all combine the two, each under its own assumptions. When the samples share well-chosen variables and measure them in the same way, hybrid designs can reduce both cost and bias. When those conditions fail, the probability sample remains the more reliable guide.
References
Baker, R., Brick, J. M., Bates, N. A., Battaglia, M., Couper, M. P., Dever, J. A., Gile, K. J., & Tourangeau, R. (2013). Summary report of the AAPOR task force on non-probability sampling. Journal of Survey Statistics and Methodology, 1(2), 90–143. https://doi.org/10.1093/jssam/smt008
Beaumont, J.-F. (2020). Are probability surveys bound to disappear for the production of official statistics? Survey Methodology, 46(1), 1–28.
Brick, J. M. (2011). The future of survey sampling. Public Opinion Quarterly, 75(5), 872–888. https://doi.org/10.1093/poq/nfr045
Chen, Y., Li, P., & Wu, C. (2020). Doubly robust inference with nonprobability survey samples. Journal of the American Statistical Association, 115(532), 2011–2021. https://doi.org/10.1080/01621459.2019.1677241
Cornesse, C., Blom, A. G., Dutwin, D., Krosnick, J. A., De Leeuw, E. D., Legleye, S., Pasek, J., Pennay, D., Phillips, B., Sakshaug, J. W., Struminskaya, B., & Wenz, A. (2020). A review of conceptual approaches and empirical evidence on probability and nonprobability sample survey research. Journal of Survey Statistics and Methodology, 8(1), 4–36. https://doi.org/10.1093/jssam/smz041
DiSogra, C., Cobb, C., Chan, E., & Dennis, J. M. (2011). Calibrating non-probability internet samples with probability samples using early adopter characteristics. In Proceedings of the Survey Research Methods Section (pp. 4501–4515). American Statistical Association.
Dutwin, D., & Buskirk, T. D. (2017). Apples to oranges or gala versus golden delicious? Comparing data quality of nonprobability internet samples to low response rate probability samples. Public Opinion Quarterly, 81(S1), 213–239. https://doi.org/10.1093/poq/nfw061
Elliott, M. R., & Valliant, R. (2017). Inference for nonprobability samples. Statistical Science, 32(2), 249–264. https://doi.org/10.1214/16-STS598
Kalton, G., & Flores-Cervantes, I. (2003). Weighting methods. Journal of Official Statistics, 19(2), 81–97.
Kim, J. K., Park, S., Chen, Y., & Wu, C. (2021). Combining non-probability and probability survey samples through mass imputation. Journal of the Royal Statistical Society: Series A, 184(3), 941–963. https://doi.org/10.1111/rssa.12696
Lee, S., & Valliant, R. (2009). Estimation for volunteer panel web surveys using propensity score adjustment and calibration adjustment. Sociological Methods & Research, 37(3), 319–343. https://doi.org/10.1177/0049124108329643
Lee, S. (2006). Propensity score adjustment as a weighting scheme for volunteer panel web surveys. Journal of Official Statistics, 22(2), 329–349.
Mercer, A., Lau, A., & Kennedy, C. (2018). For weighting online opt-in samples, what matters most? Pew Research Center.
Mercer, A. W., Kreuter, F., Keeter, S., & Stuart, E. A. (2017). Theory and practice in nonprobability surveys: Parallels between causal inference and survey inference. Public Opinion Quarterly, 81(S1), 250–271. https://doi.org/10.1093/poq/nfw060
Rao, J. N. K. (2021). On making valid inferences by integrating data from surveys and other sources. Sankhya B, 83, 242–272. https://doi.org/10.1007/s13571-020-00227-w
Sakshaug, J. W., Wiśniowski, A., Perez Ruiz, D. A., & Blom, A. G. (2019). Supplementing small probability samples with nonprobability samples: A Bayesian approach. Journal of Official Statistics, 35(3), 653–681. https://doi.org/10.2478/jos-2019-0027
Schonlau, M., van Soest, A., Kapteyn, A., & Couper, M. (2009). Selection bias in web surveys and the use of propensity scores. Sociological Methods & Research, 37(3), 291–318. https://doi.org/10.1177/0049124108327128
Valliant, R., & Dever, J. A. (2011). Estimating propensity adjustments for volunteer web surveys. Sociological Methods & Research, 40(1), 105–137. https://doi.org/10.1177/0049124110392533
Wiśniowski, A., Sakshaug, J. W., Perez Ruiz, D. A., & Blom, A. G. (2020). Integrating probability and nonprobability samples for survey inference. Journal of Survey Statistics and Methodology, 8(1), 120–147. https://doi.org/10.1093/jssam/smz051
Yang, S., & Kim, J. K. (2020). Statistical data integration in survey sampling: A review. Japanese Journal of Statistics and Data Science, 3, 625–650. https://doi.org/10.1007/s42081-020-00093-w
Yeager, D. S., Krosnick, J. A., Chang, L., Javitz, H. S., Levendusky, M. S., Simpser, A., & Wang, R. (2011). Comparing the accuracy of RDD telephone surveys and internet surveys conducted with probability and non-probability samples. Public Opinion Quarterly, 75(4), 709–747. https://doi.org/10.1093/poq/nfr020