
Statistics · Communication and misuse
Communicating Uncertainty to Non-Specialist Audiences
Practical, evidence-based ways to explain margins of error, ranges and risks to managers, clients and the public without hiding the uncertainty or burying the message.
Every survey estimate, forecast and model result carries uncertainty. Specialists express it through standard errors, confidence intervals and probability distributions, but most people who act on the results are not specialists. Communicating uncertainty well means being honest about what is not known without burying the message. van der Bles et al. (2019) distinguish direct uncertainty about a number itself, such as a margin of error, from indirect uncertainty about the quality of the evidence behind it, such as a small or unrepresentative sample. Both matter to decision-makers, and both can be communicated in plain language.
Why it is hard
Even trained people misread standard statistical expressions. Hoekstra et al. (2014) found that most researchers and students endorsed false statements about what a confidence interval means. Probabilities stated as conditional percentages are also hard to combine: in the experiments of Gigerenzer and Hoffrage (1995), far more people solved a Bayesian reasoning problem when the information was given as natural frequencies ("10 out of 1,000") than as probabilities. Hoffrage et al. (2000) showed that the same format helped experts such as physicians and lawyers. Words alone are no cure either, because terms such as "likely" or "possible" mean very different probabilities to different listeners (Spiegelhalter, 2017).
Principles that work
- Use expected frequencies. "About 3 in 100 customers" is easier to grasp than "a 3% probability", and it makes the reference group explicit (Spiegelhalter, 2017).
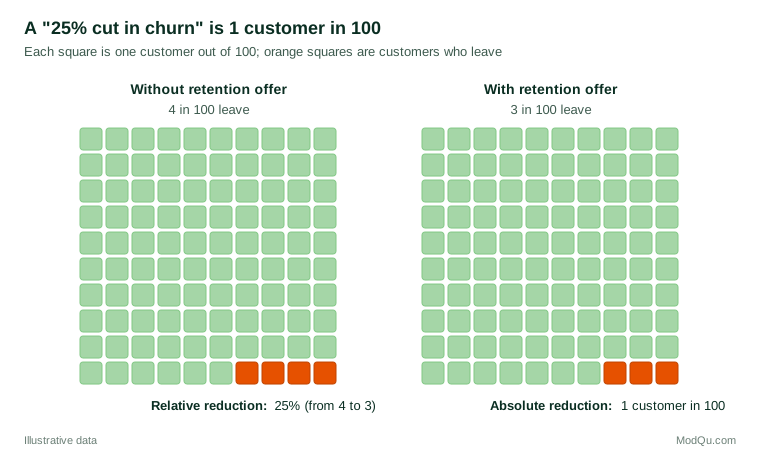
- Give absolute as well as relative changes. Gigerenzer et al. (2007) show that relative changes presented alone make effects look larger than they are and mislead professionals and lay people alike.
- Give a range around a best estimate. "Most likely about 42%, and very probably between 38% and 46%" conveys both the estimate and its precision.
- Pair words with numbers. If a verbal label such as "likely" is used, say what range of probability it stands for, and use the same labels consistently across reports.
- Show it visually. Icon arrays, fan charts and shaded bands make uncertainty visible without formulas (Spiegelhalter et al., 2011).
- Say what the uncertainty covers. A margin of error reflects sampling error only. It does not cover nonresponse bias, question wording or coverage error, so note any doubts about the quality of the evidence separately.
- Link it to the decision. Explain what the uncertainty means for the choice at hand, for example "whichever figure in this range is true, the campaign pays for itself".
A worked example
Suppose a hypothetical brand tracker finds that 42% of 600 people in the target market are aware of a brand, up from 40% last quarter. The margin of error at 95% confidence is about ±4 percentage points, assuming simple random sampling. A technical report might say "42% (95% CI 38% to 46%)". For a non-specialist audience, a clearer version is:
About 42 in every 100 people in the target market know the brand. Because we surveyed a sample, the true figure is very probably between 38 and 46 in 100. The rise from 40 last quarter is smaller than this uncertainty, so we cannot yet say that awareness has grown; another quarter of data will show whether the trend is real.
Behind that judgement is a simple check: the difference between two independent samples of 600 has its own margin of error, about ±5.6 points, which comfortably includes the observed 2-point rise. This version uses frequencies, gives a range, states what the range means, and draws the practical conclusion. It neither hides the uncertainty nor lets it swamp the finding.
Common mistakes
- Spurious precision. Reporting "42.3%" from a sample of 600 implies accuracy that the data cannot support.
- Losing uncertainty in summaries. Executive summaries and slide titles often drop the ranges that the full report contains.
- Reporting only relative changes. "Doubled" may mean a move from 1 in 1,000 to 2 in 1,000.
- Treating "not significant" as "no effect". A wide interval that includes zero is a sign of too little evidence, not proof of no difference.
- Overloading the audience. Technical detail belongs in an appendix; the main text should give the range and what it implies.
Key takeaways
Non-specialists can understand uncertainty when it is expressed in familiar terms. Use natural frequencies, absolute changes, ranges around a best estimate and simple visuals; say what the uncertainty does and does not cover; and connect it to the decision. Done well, communicating uncertainty builds trust rather than undermining it.
References
Gigerenzer, G., Gaissmaier, W., Kurz-Milcke, E., Schwartz, L. M., & Woloshin, S. (2007). Helping doctors and patients make sense of health statistics. Psychological Science in the Public Interest, 8(2), 53–96. https://doi.org/10.1111/j.1539-6053.2008.00033.x
Gigerenzer, G., & Hoffrage, U. (1995). How to improve Bayesian reasoning without instruction: Frequency formats. Psychological Review, 102(4), 684–704. https://doi.org/10.1037/0033-295X.102.4.684
Hoekstra, R., Morey, R. D., Rouder, J. N., & Wagenmakers, E.-J. (2014). Robust misinterpretation of confidence intervals. Psychonomic Bulletin & Review, 21(5), 1157–1164. https://doi.org/10.3758/s13423-013-0572-3
Hoffrage, U., Lindsey, S., Hertwig, R., & Gigerenzer, G. (2000). Communicating statistical information. Science, 290(5500), 2261–2262. https://doi.org/10.1126/science.290.5500.2261
Spiegelhalter, D. (2017). Risk and uncertainty communication. Annual Review of Statistics and Its Application, 4(1), 31–60. https://doi.org/10.1146/annurev-statistics-010814-020148
Spiegelhalter, D., Pearson, M., & Short, I. (2011). Visualizing uncertainty about the future. Science, 333(6048), 1393–1400. https://doi.org/10.1126/science.1191181
van der Bles, A. M., van der Linden, S., Freeman, A. L. J., Mitchell, J., Galvão, A. B., Zaval, L., & Spiegelhalter, D. J. (2019). Communicating uncertainty about facts, numbers and science. Royal Society Open Science, 6(5), Article 181870. https://doi.org/10.1098/rsos.181870