
Statistics · Communication and misuse
Statistical Literacy as a Business Skill
What statistical literacy means for managers and other non-specialists, which reasoning skills matter most in business, and how organisations can build the habit of questioning numbers well.
Business decisions increasingly rest on numbers: dashboards, A/B tests, customer surveys, market sizing and forecasts. The people who act on those numbers are mostly not statisticians, and they do not need to be. What they need is statistical literacy: the ability to read, interpret and question statistical information, and to recognise when a number can bear the weight of a decision and when it cannot. This article explains what the skill involves, why it matters commercially, and how organisations can develop it.
What statistical literacy means
Gal (2002) defines adult statistical literacy as the ability to interpret and critically evaluate statistical information and to discuss or communicate reactions to it. In his model it combines knowledge elements (general literacy, statistical and mathematical knowledge, knowledge of the context, and a set of critical questions) with dispositions such as a critical stance and the confidence to use it. The emphasis is on informed consumption rather than calculation.
Statistical literacy is therefore not the same as being good at arithmetic or software. Cobb and Moore (1997) stress that in statistics the context supplies the meaning: data are numbers with a context, and the same figure can be reassuring in one setting and alarming in another. Wild and Pfannkuch (1999), describing how statisticians actually think in empirical enquiry, identify core habits that transfer directly to business: recognising when data are needed, considering variation, reasoning with models, and continually moving between statistical results and knowledge of the real situation.
Why it matters commercially
The volume of data available to organisations has grown enormously, and Donoho (2017) describes how this has turned data analysis into a broad field reaching well beyond traditional statistics. More data does not automatically mean better answers. Meng (2018) showed that the error of an estimate from a non-random sample depends on the correlation between being included and the value being measured, and that even a tiny correlation can overwhelm a huge sample: in his analysis of the 2016 United States presidential election, a self-reported sample of about 2.3 million people had the same mean squared error as a simple random sample of about 400. A manager who judges evidence by its size alone will be misled.
Deming (1975) made a related point decades earlier. Most business studies are not undertaken to describe a fixed population but to guide action, so the real question is what will happen if a decision is taken. He called these analytic studies, as distinct from enumerative ones, and argued that their reliability depends on judgement about whether conditions will stay the same, not only on sampling error. Statistically literate managers ask that question as a matter of course: will the customers, prices and competitors next year resemble those in the data, and if not, how far can the result be trusted?
Six reasoning skills that matter most
1. Asking where the data came from
Every number has a production history: who was asked or measured, how, and who was missed. The total survey error framework sets out the errors that can arise from coverage, sampling, nonresponse, measurement and processing (Groves & Lyberg, 2010). A literate reader asks about these before asking about the result.
2. Expecting variation
People tend to expect small samples to resemble the population closely, a tendency Tversky and Kahneman (1971) called belief in the "law of small numbers". In business it shows up when the best and worst branches in a league table are simply the smallest ones, or when one month's dip in satisfaction triggers a reorganisation. Recognising noise prevents costly over-reaction.
3. Using base rates
Casscells et al. (1978) asked physicians and medical students to interpret a positive result from a test for a disease affecting 1 in 1,000 people, with a 5% false-positive rate. The correct answer was about 2%, yet fewer than one in five gave it, and the most common answer was 95%. Gigerenzer et al. (2007) document many similar failures, which they call collective statistical illiteracy, and show that presenting information as natural frequencies largely removes the difficulty. The same reasoning applies to fraud alerts, lead-scoring models and quality checks.
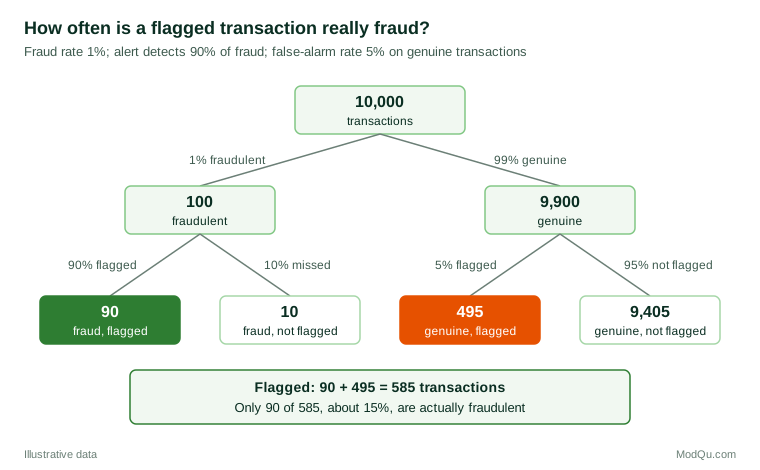
Figure 1 shows the reasoning with a hypothetical fraud alert. Out of 10,000 transactions, 100 are fraudulent and the alert catches 90 of them. It also flags 5% of the 9,900 genuine transactions, which is 495. Of the 585 flagged transactions, only 90 are fraudulent, so a flag means roughly a 15% chance of fraud, not the 90% or 95% many people would guess. A team that understands this will size its review staff, and its expectations, accordingly.
4. Separating association from cause, and watching aggregation
A correlation between a marketing activity and sales does not show that the activity caused the sales. Aggregated figures can also reverse when broken down. In the well-known study of graduate admissions at Berkeley, women had a lower overall admission rate than men, but department by department there was little evidence of bias against them, because women had applied more often to the departments that admitted fewer applicants (Bickel et al., 1975). Where causal questions matter, controlled experiments are the most reliable answer, and Kohavi et al. (2020) report that many ideas that look promising fail to improve key metrics when properly tested.
5. Reading significance and uncertainty correctly
The American Statistical Association's statement on p-values warns that a p-value does not measure the size or importance of an effect, and that decisions should not rest only on whether it passes a threshold (Wasserstein & Lazar, 2016). Literate readers look for effect sizes and confidence intervals, and they understand that "not statistically significant" usually means "not enough evidence", not "no effect".
6. Noticing one's own biases
Tversky and Kahneman (1974) showed that people judging under uncertainty rely on heuristics such as representativeness, availability and anchoring, which lead to systematic errors. A vivid customer complaint, a memorable competitor launch or an early forecast can anchor judgement more than the data do. Knowing these tendencies is the first step to checking them.
Questions to ask about any number
A short set of questions captures most of these skills:
- What exactly was measured, and how was the question asked?
- Who is included, and who is missing?
- Compared with what: last period, a control group, a benchmark?
- How big is the difference in absolute terms, and how uncertain is it?
- Could chance, selection or a third factor explain it?
- What decision would change if the number were different?
Building statistical literacy in an organisation
- Teach with the organisation's own data. Examples from familiar reports make abstract ideas concrete and show where past decisions went wrong.
- Set reporting standards. Require bases, intervals and comparisons in dashboards and research reports, so that uncertainty is visible by default.
- Pair analysts with decision-makers. Analysts learn the business context, and managers learn which questions to ask.
- Reward good questions. A culture in which challenging a number is welcomed, not seen as obstruction, catches errors early.
- Use experiments where possible. Testing changes in a controlled way builds familiarity with variation and humility about intuition.
Common mistakes
- Treating statistical literacy as a technical skill for analysts only, rather than a shared competence for anyone who uses data.
- Accepting numbers uncritically because they look precise, or dismissing them cynically because "you can prove anything with statistics".
- Judging evidence by sample size or data volume rather than by how the data were selected.
- Reacting to every movement in a tracker without asking whether it exceeds normal variation.
- Reading statistical significance as practical importance.
Key takeaways
Statistical literacy is the capacity to understand and question numbers well enough to use them wisely. For business, its core is a habit of asking where data came from, what they are compared with, how much they vary and what else could explain them. These skills protect organisations from expensive mistakes and help them get full value from survey data, experiments and analytics, and they can be taught.
References
Bickel, P. J., Hammel, E. A., & O'Connell, J. W. (1975). Sex bias in graduate admissions: Data from Berkeley. Science, 187(4175), 398–404. https://doi.org/10.1126/science.187.4175.398
Casscells, W., Schoenberger, A., & Graboys, T. B. (1978). Interpretation by physicians of clinical laboratory results. New England Journal of Medicine, 299(18), 999–1001. https://doi.org/10.1056/NEJM197811022991808
Cobb, G. W., & Moore, D. S. (1997). Mathematics, statistics, and teaching. The American Mathematical Monthly, 104(9), 801–823. https://doi.org/10.1080/00029890.1997.11990723
Deming, W. E. (1975). On probability as a basis for action. The American Statistician, 29(4), 146–152. https://doi.org/10.1080/00031305.1975.10477402
Donoho, D. (2017). 50 years of data science. Journal of Computational and Graphical Statistics, 26(4), 745–766. https://doi.org/10.1080/10618600.2017.1384734
Gal, I. (2002). Adults' statistical literacy: Meanings, components, responsibilities. International Statistical Review, 70(1), 1–25. https://doi.org/10.1111/j.1751-5823.2002.tb00336.x
Gigerenzer, G., Gaissmaier, W., Kurz-Milcke, E., Schwartz, L. M., & Woloshin, S. (2007). Helping doctors and patients make sense of health statistics. Psychological Science in the Public Interest, 8(2), 53–96. https://doi.org/10.1111/j.1539-6053.2008.00033.x
Groves, R. M., & Lyberg, L. (2010). Total survey error: Past, present, and future. Public Opinion Quarterly, 74(5), 849–879. https://doi.org/10.1093/poq/nfq065
Kohavi, R., Tang, D., & Xu, Y. (2020). Trustworthy online controlled experiments: A practical guide to A/B testing. Cambridge University Press. https://doi.org/10.1017/9781108653985
Meng, X.-L. (2018). Statistical paradises and paradoxes in big data (I): Law of large populations, big data paradox, and the 2016 US presidential election. The Annals of Applied Statistics, 12(2), 685–726. https://doi.org/10.1214/18-AOAS1161SF
Tversky, A., & Kahneman, D. (1971). Belief in the law of small numbers. Psychological Bulletin, 76(2), 105–110. https://doi.org/10.1037/h0031322
Tversky, A., & Kahneman, D. (1974). Judgment under uncertainty: Heuristics and biases. Science, 185(4157), 1124–1131. https://doi.org/10.1126/science.185.4157.1124
Wasserstein, R. L., & Lazar, N. A. (2016). The ASA statement on p-values: Context, process, and purpose. The American Statistician, 70(2), 129–133. https://doi.org/10.1080/00031305.2016.1154108
Wild, C. J., & Pfannkuch, M. (1999). Statistical thinking in empirical enquiry. International Statistical Review, 67(3), 223–248. https://doi.org/10.1111/j.1751-5823.1999.tb00442.x