
Statistics · Communication and misuse
Reproducible Statistical Analysis: Scripts, Versioning and Documentation
Why every published number should be traceable to raw data and code, and how scripts, version control and documentation make survey and business analyses checkable, repeatable and cheaper to run.
A client asks why the satisfaction score for one region in last year's tracker report differs from the figure in this year's trend chart. The analyst who produced it has moved on, the spreadsheet has six tabs named "final", and nobody can say which recodes, exclusions and weights were applied. The number may well be right. The problem is that no one can show that it is.
Reproducible analysis is the discipline that prevents this situation. Its central idea is simple: every number in a report should be regenerated, exactly, from the raw data by running recorded code. Buckheit and Donoho (1995), summarising the geophysicist Jon Claerbout, put the point memorably: an article about computational work is only the advertising of the scholarship, while the scholarship itself is the full set of instructions and data that produced the figures. This article explains what reproducibility means, why it fails, and how scripts, version control and documentation make it routine in survey research and business analytics.
What "reproducible" means
The words reproducible and replicable are used inconsistently across fields, so it helps to fix definitions. A report of the US National Academies of Sciences, Engineering, and Medicine (2019) defines reproducibility as obtaining consistent results using the same input data, computational steps, methods, code and conditions of analysis. Replicability means obtaining consistent results across studies that address the same question, each with its own data. Reproducibility is therefore the minimum standard: if an analysis cannot be reproduced from its own data, there is nothing stable to replicate.
Goodman et al. (2016) further separate methods reproducibility (enough detail to repeat the procedures), results reproducibility and inferential reproducibility (drawing the same conclusions). This article is mainly about the first.
Peng (2011) describes reproducibility as a spectrum rather than a yes-or-no property. At one end is a publication alone; next come publication with code, then code and data, then linked and executable code and data; full replication sits at the far end. Most business reports sit at the "publication only" end. Moving even one step along the spectrum, for example by keeping the code that produced a deck alongside the deck, removes a large share of the risk.
Why analyses fail to reproduce
Irreproducibility is common. In a survey of 1,576 researchers published in Nature, more than 70% said they had tried and failed to reproduce another scientist's experiments, and more than half had failed to reproduce their own (Baker, 2016). Stodden et al. (2018) requested the data and code behind computational articles published in Science after the journal introduced a data-sharing policy. They obtained the materials for 44% of the articles and estimated that the findings could be reproduced for about 26%.
The causes are mostly mundane:
- Manual steps. Copying, pasting, filtering and editing cells by hand leave no record. Herndon et al. (2014) re-examined an influential study of public debt and economic growth and found, among other problems, a spreadsheet error that left several countries out of a key average. Correcting it and the other issues changed the headline result substantially.
- Silent software behaviour. Ziemann et al. (2016) found that about one-fifth of genomics papers with supplementary Excel gene lists contained gene names that the spreadsheet had automatically converted into dates or numbers.
- Untracked versions. When files are copied and renamed rather than versioned, nobody can tell which version of a script produced which figure.
- Undocumented decisions. Exclusion rules, recodes and weighting targets often live only in the analyst's memory.
Baggerly and Coombes (2009) give a cautionary example from biomedical research. Trying to reproduce published predictions of drug sensitivity from gene expression data, they uncovered simple errors such as mislabelled samples and rows offset by one. Their term for this work, "forensic bioinformatics", describes how much effort is needed to reconstruct an analysis after the fact, compared with how little it would have cost to record it at the time.
Principle 1: treat raw data as read-only
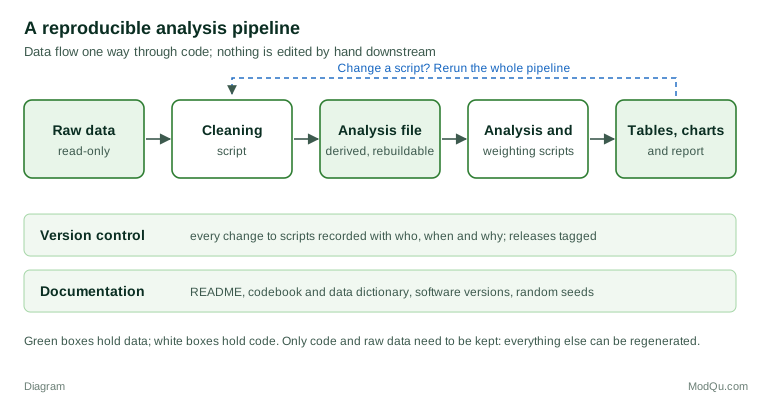
The foundation of a reproducible workflow is a clear separation between raw data, code and outputs (Figure 1). The raw data file, as delivered by the fieldwork system or the client, is never edited. Every correction, recode and exclusion happens in code that reads the raw file and writes a new, derived file. If the raw file is damaged or overwritten, nothing can be rebuilt; if a derived file is lost, it can be regenerated in minutes.
How the data are laid out matters too. Broman and Woo (2018) set out practical rules for data kept in spreadsheets: be consistent in codes and names, write dates in the YYYY-MM-DD format, put one piece of information in each cell, keep the data rectangular, create a data dictionary, do not use colour or font as data, avoid calculations in the raw data file, and save a plain-text copy. Wickham (2014) describes the "tidy" layout in which each variable forms a column, each observation forms a row and each type of observational unit forms a table.
Principle 2: scripts, not clicks
Every step from raw data to published figure should be expressed as code that can be rerun: in R, Python, SAS, SPSS syntax, Stata or SQL. The language matters much less than the habit. Point-and-click analysis and manual spreadsheet edits can produce correct numbers, but they leave no executable record of how those numbers were made.
Sandve et al. (2013) give ten simple rules for reproducible computational research. Several translate directly to market research and business analysis:
- keep track of how every result was produced;
- avoid manual data manipulation steps;
- archive the exact versions of all external programs used;
- put all custom scripts under version control;
- record the random seed for any analysis that involves randomness, such as bootstrap intervals or imputation;
- always store the raw data behind plots;
- connect statements in the text to the underlying results.
Wilson et al. (2017) add "good enough" practices for analysts who are not software engineers, such as saving raw data separately, breaking programs into short, well-named functions and organising each project in a predictable folder structure.
In survey work the steps most worth scripting are those most often done by hand: back-coding open-ended "other" answers, applying exclusion rules for speeders and straightliners, deriving variables such as Net Promoter Score categories, computing weights, and applying suppression rules for small cells. Weighting targets and trimming limits deserve particular care, as they are rarely recorded anywhere else.
A useful test is whether the whole report can be rebuilt with one command from an empty output folder. If any step requires someone to remember to do something, the analysis is not yet reproducible.
Principle 3: version control
Saving files as "tracker_v3_final_REVISED.xlsx" is a version control system, just a poor one. Dedicated tools such as Git record every change to every file, with the author, the date and a short message explaining why the change was made. Ram (2013) argues that Git can facilitate greater reproducibility and transparency in science, because it provides a complete, timestamped history of a project and makes it possible to return to the exact state of the code that produced any earlier result. Bryan (2018) makes the same case for statisticians, noting that hosting services add review and backup.
For analytic teams the benefits are practical:
- Traceability. Each published report can be tied to a tagged version of the code, so last year's figures can be regenerated exactly.
- Safe experimentation. An analyst can try an alternative weighting scheme on a separate branch without disturbing the production code.
- Review and collaboration. Colleagues can see exactly what changed between two waves before results go to a client, and several people can work on one project without overwriting each other.
Two cautions apply. First, version control is designed for code and small text files, not for large or confidential data. Respondent-level files containing personal information should not be committed to a repository, and certainly not to a public one; they belong in secure storage, with the code recording where they are and which version was used. Second, the history is only as useful as the commit messages. "Changed weights" is less helpful than "Trim weights at 5 to match the agreed specification for wave 12".
Principle 4: record the computing environment
Code that runs today may give different results, or fail, after a software update, as packages change their defaults and functions are deprecated. A reproducible project therefore records the versions of the language and of every package used. Lock files capture this list; containers go further and package the whole operating environment.
Marwick et al. (2018) recommend organising each analysis as a "research compendium": a standard folder structure containing data, code, documentation and a description of dependencies, so that anyone can see what is needed and run it. Gentleman and Temple Lang (2007) proposed the compendium idea for statistical analyses, combining text, code and data in a single unit that can be distributed and rerun.
Principle 5: document as you go
Documentation is what allows a person, including the original analyst a year later, to understand what the code does and why. Four layers are useful:
- A README at the top of the project explaining its purpose, how to run it, what inputs it needs and what outputs it produces.
- A codebook or data dictionary describing every variable: its question wording, value labels, missing-value codes, derivation and any changes between waves. This is the metadata that makes a data file interpretable.
- Comments and decision logs in the code explaining why, not just what: why a quota cell was collapsed, why a speeding threshold was chosen, why an outlier was kept.
- Literate documents that combine code and narrative.
The last idea goes back to Knuth (1984), who proposed literate programming: writing programs as documents meant to be read by people, with code embedded in explanation. Modern tools such as R Markdown, Quarto and Jupyter notebooks apply the same principle to data analysis. Text, tables and charts are generated by the code each time the document is rendered, so a number in a sentence cannot drift out of step with the number in the table beneath it.
For data that will be shared or reused, the FAIR principles of Wilkinson et al. (2016) provide a widely adopted standard: data and metadata should be findable, accessible, interoperable and reusable. Applied to internal survey archives, they make past waves far easier to find and reanalyse. Provenance, the record of where each data set came from and what was done to it, is the thread that connects them.
A worked example: a quarterly brand tracker
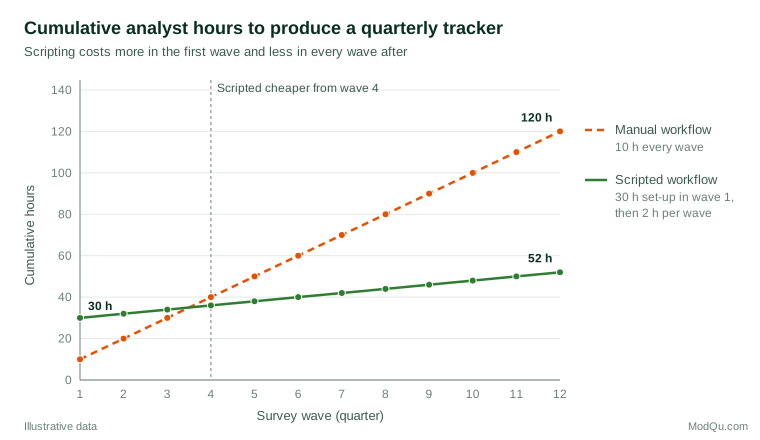
Consider a hypothetical brand tracker fielded every quarter with 1,500 respondents. In a manual workflow, an analyst downloads the data, cleans it in a spreadsheet, weights it in a separate program, copies tables into a slide template and edits the charts by hand. Suppose this takes about 10 hours each wave and the steps change slightly each time.
In a scripted workflow, the analyst spends about 30 hours in the first wave writing and testing scripts for cleaning, weighting, tabulation and chart production, and setting up a version-controlled project with a README and codebook. In later waves the work is mostly running the pipeline, checking outputs and updating commentary, say 2 hours each wave. The numbers are illustrative (Figure 2).
The time saving is only part of the gain. In the scripted version, a project folder might look like this:
| Folder or file | Contents | Edited by hand? |
|---|---|---|
| data/raw/ | Fieldwork exports, one per wave | Never |
| R/ or py/ | Cleaning, weighting and tabulation scripts | Yes, under version control |
| data/derived/ | Cleaned, weighted analysis files | Never (regenerated) |
| output/ | Tables, charts, report | Never (regenerated) |
| README, codebook | Purpose, instructions, variable definitions | Yes, under version control |
When the client asks the question from the opening paragraph, the analyst checks out the version tagged for last year's report, reruns it and compares the two outputs. The difference turns out to be a change in the regional weighting targets after a census update, documented in a commit message. The answer takes minutes rather than days, and it is evidence rather than recollection.
Reproducible is not the same as correct
A reproducible analysis can still be wrong. A coding error that is faithfully rerun every quarter is a reproducible error. Reproducibility makes errors findable; it does not prevent them. Code review, sanity checks against known totals and comparison with previous waves are still needed.
Nor does reproducibility solve the problem of analytic flexibility. Simmons et al. (2011) showed how undisclosed choices about which observations to exclude, which covariates to include and when to stop collecting data can make almost any result look statistically significant. Gelman and Loken (2014) describe a subtler version, the "garden of forking paths", in which analysts never consciously try many analyses but let the data guide their choices, so that reported p-values overstate the evidence. A script that records only the final path hides the paths not taken.
Two practices address this. The first is to write down the analysis plan before seeing the outcome data, the core idea of pre-registration (Nosek et al., 2018). In commercial research, a short specification agreed with the client before fieldwork, covering exclusion rules, key comparisons, weighting and significance criteria, serves much the same purpose. The second is to keep exploratory and confirmatory work clearly labelled, and to report how results change under reasonable alternative choices. Munafò et al. (2017), in A manifesto for reproducible science, list measures of this kind, including protocol pre-registration, improved reporting, transparency and the sharing of data and code, as ways to improve the reliability of research.
These concerns are not abstract. When the Open Science Collaboration (2015) repeated 100 published psychology studies, 97% of the originals had reported statistically significant results, but only 36% of the replications did. Business research faces the same pressures as academic research: a strong prior expectation, a deadline and many defensible ways to cut the data.
Practical guidance for survey and business teams
- Start small. Moving one recurring report from manual steps to a script delivers much of the benefit.
- Script the risky steps first: exclusions, recodes, weighting and suppression rules.
- Use version control for code and documentation, with a tag for each delivered report, but never commit confidential respondent data.
- Keep a codebook that tracks question wording and coding changes across waves.
- Agree an analysis specification before fieldwork and log any deviations from it.
- Ask a colleague to rerun the project from a clean copy before delivery. If they cannot, it is not reproducible.
Common mistakes
- Editing outputs by hand. Fixing a number directly in a slide or table breaks the link to the code, and the fix disappears the next time the pipeline runs.
- Overwriting raw data. Once the original export is altered, errors in cleaning can no longer be detected or undone.
- Hard-coded paths and values. Scripts that refer to one person's desktop, or type in sample sizes as numbers, break on another machine or wave.
- Trusting spreadsheet defaults. Automatic conversion of codes, identifiers and dates can silently corrupt data (Ziemann et al., 2016).
- Documenting at the end. Notes written after the project is finished are incomplete and often wrong.
- Confusing reproducibility with validity. A reproducible analysis of a biased sample, or one shaped by unreported choices, is still misleading.
Key takeaways
Reproducible analysis means that every published figure can be regenerated from the raw data by running recorded code. It rests on four habits: keep raw data read-only, express every step as a script, track every change with version control, and document data, code and decisions as the work proceeds. The cost is a modest investment at the start; the return is faster repeated reports, easier review and analyses that survive staff changes. Reproducibility does not guarantee that an analysis is correct, but it makes errors visible and correctable, which is the precondition for trusting any number a client is asked to act on.
References
Baggerly, K. A., & Coombes, K. R. (2009). Deriving chemosensitivity from cell lines: Forensic bioinformatics and reproducible research in high-throughput biology. The Annals of Applied Statistics, 3(4), 1309–1334. https://doi.org/10.1214/09-AOAS291
Baker, M. (2016). 1,500 scientists lift the lid on reproducibility. Nature, 533(7604), 452–454. https://doi.org/10.1038/533452a
Broman, K. W., & Woo, K. H. (2018). Data organization in spreadsheets. The American Statistician, 72(1), 2–10. https://doi.org/10.1080/00031305.2017.1375989
Bryan, J. (2018). Excuse me, do you have a moment to talk about version control? The American Statistician, 72(1), 20–27. https://doi.org/10.1080/00031305.2017.1399928
Buckheit, J. B., & Donoho, D. L. (1995). WaveLab and reproducible research. In A. Antoniadis & G. Oppenheim (Eds.), Wavelets and statistics (pp. 55–81). Springer. https://doi.org/10.1007/978-1-4612-2544-7_5
Gelman, A., & Loken, E. (2014). The statistical crisis in science. American Scientist, 102(6), 460–465. https://doi.org/10.1511/2014.111.460
Gentleman, R., & Temple Lang, D. (2007). Statistical analyses and reproducible research. Journal of Computational and Graphical Statistics, 16(1), 1–23. https://doi.org/10.1198/106186007X178663
Goodman, S. N., Fanelli, D., & Ioannidis, J. P. A. (2016). What does research reproducibility mean? Science Translational Medicine, 8(341), Article 341ps12. https://doi.org/10.1126/scitranslmed.aaf5027
Herndon, T., Ash, M., & Pollin, R. (2014). Does high public debt consistently stifle economic growth? A critique of Reinhart and Rogoff. Cambridge Journal of Economics, 38(2), 257–279. https://doi.org/10.1093/cje/bet075
Knuth, D. E. (1984). Literate programming. The Computer Journal, 27(2), 97–111. https://doi.org/10.1093/comjnl/27.2.97
Marwick, B., Boettiger, C., & Mullen, L. (2018). Packaging data analytical work reproducibly using R (and friends). The American Statistician, 72(1), 80–88. https://doi.org/10.1080/00031305.2017.1375986
Munafò, M. R., Nosek, B. A., Bishop, D. V. M., Button, K. S., Chambers, C. D., Percie du Sert, N., Simonsohn, U., Wagenmakers, E.-J., Ware, J. J., & Ioannidis, J. P. A. (2017). A manifesto for reproducible science. Nature Human Behaviour, 1(1), Article 0021. https://doi.org/10.1038/s41562-016-0021
National Academies of Sciences, Engineering, and Medicine. (2019). Reproducibility and replicability in science. The National Academies Press. https://doi.org/10.17226/25303
Nosek, B. A., Ebersole, C. R., DeHaven, A. C., & Mellor, D. T. (2018). The preregistration revolution. Proceedings of the National Academy of Sciences, 115(11), 2600–2606. https://doi.org/10.1073/pnas.1708274114
Open Science Collaboration. (2015). Estimating the reproducibility of psychological science. Science, 349(6251), Article aac4716. https://doi.org/10.1126/science.aac4716
Peng, R. D. (2011). Reproducible research in computational science. Science, 334(6060), 1226–1227. https://doi.org/10.1126/science.1213847
Ram, K. (2013). Git can facilitate greater reproducibility and increased transparency in science. Source Code for Biology and Medicine, 8(1), Article 7. https://doi.org/10.1186/1751-0473-8-7
Sandve, G. K., Nekrutenko, A., Taylor, J., & Hovig, E. (2013). Ten simple rules for reproducible computational research. PLoS Computational Biology, 9(10), Article e1003285. https://doi.org/10.1371/journal.pcbi.1003285
Simmons, J. P., Nelson, L. D., & Simonsohn, U. (2011). False-positive psychology: Undisclosed flexibility in data collection and analysis allows presenting anything as significant. Psychological Science, 22(11), 1359–1366. https://doi.org/10.1177/0956797611417632
Stodden, V., Seiler, J., & Ma, Z. (2018). An empirical analysis of journal policy effectiveness for computational reproducibility. Proceedings of the National Academy of Sciences, 115(11), 2584–2589. https://doi.org/10.1073/pnas.1708290115
Wickham, H. (2014). Tidy data. Journal of Statistical Software, 59(10). https://doi.org/10.18637/jss.v059.i10
Wilkinson, M. D., Dumontier, M., Aalbersberg, I. J., Appleton, G., Axton, M., Baak, A., Blomberg, N., Boiten, J.-W., da Silva Santos, L. B., Bourne, P. E., Bouwman, J., Brookes, A. J., Clark, T., Crosas, M., Dillo, I., Dumon, O., Edmunds, S., Evelo, C. T., Finkers, R., … Mons, B. (2016). The FAIR Guiding Principles for scientific data management and stewardship. Scientific Data, 3(1), Article 160018. https://doi.org/10.1038/sdata.2016.18
Wilson, G., Bryan, J., Cranston, K., Kitzes, J., Nederbragt, L., & Teal, T. K. (2017). Good enough practices in scientific computing. PLoS Computational Biology, 13(6), Article e1005510. https://doi.org/10.1371/journal.pcbi.1005510
Ziemann, M., Eren, Y., & El-Osta, A. (2016). Gene name errors are widespread in the scientific literature. Genome Biology, 17(1), Article 177. https://doi.org/10.1186/s13059-016-1044-7