
Statistics · Bayesian and computational
Bayesian Model Averaging for Uncertainty-Aware Knowledge Aggregation
How Bayesian model averaging combines the evidence from many plausible models, weighting each by its posterior probability, so that conclusions and forecasts reflect uncertainty about the model itself.
Most analyses report results from one model, chosen after trying several. The chosen model is then treated as if it were known to be true, and its standard errors ignore the search that produced it. Draper (1995) showed that this habit makes conclusions look more certain than the evidence allows. Bayesian model averaging (BMA) offers a principled alternative: instead of picking one model, it averages over all plausible candidates, weighting each by how well the data support it (Hoeting et al., 1999).
The idea
Suppose there are K candidate models, M1 to MK, for example regressions that use different combinations of predictors. Bayes' theorem gives each model a posterior probability, proportional to its prior probability multiplied by its marginal likelihood, the probability of the observed data under that model:
P(Mk | D) ∝ P(D | Mk) × P(Mk)
Any quantity of interest, Δ, such as a forecast or the effect of a predictor, is then a weighted average across models:
P(Δ | D) = Σk P(Δ | Mk, D) × P(Mk | D)
The resulting uncertainty has two parts: uncertainty within each model, and disagreement between models. Single-model analysis captures only the first. Marginal likelihoods are often hard to compute, so a common shortcut uses the BIC approximation, in which each model's weight is proportional to exp(−BIC/2) (Kass & Raftery, 1995). Ratios of these weights are Bayes factors, which compare how strongly the data favour one model over another.
A worked example
A hypothetical survey of 1,500 customers measures spending intention and five candidate predictors: price perception, service rating, tenure, recall of a recent advertising campaign and region. With equal prior weights, six models carry nearly all the posterior probability (Figure 1). The best model has a probability of only 41%. Reporting it alone would discard the other 59% of the evidence.
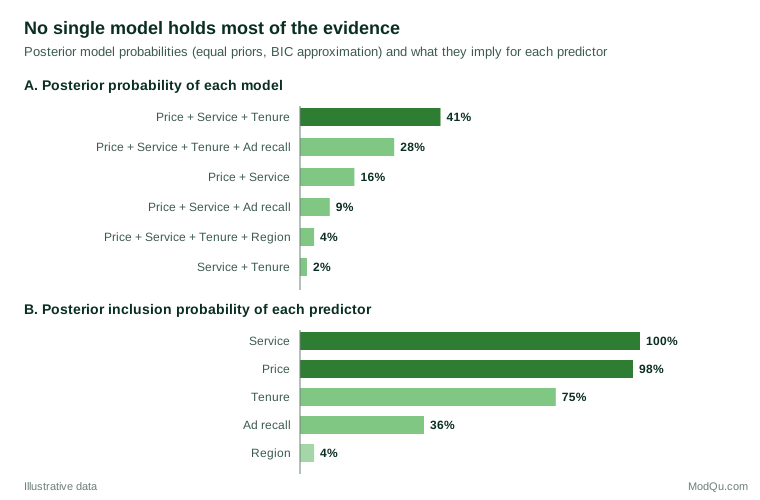
Summing the weights of the models that contain each predictor gives its posterior inclusion probability. Service and price are almost certainly relevant, tenure probably so, and region almost certainly not. Advertising recall is genuinely uncertain at 36%. In the models that include it, its estimated effect is 0.30 points on the intention scale; averaged over all models, including those where its effect is zero, the BMA estimate is about 0.11, with a wider interval. A manager who saw only the second-best model would conclude that the campaign "works"; one who saw only the best model would conclude that it does not matter. BMA reports the more honest answer: the evidence is mixed.
Why it improves knowledge aggregation
- Better predictions. Averaging over models has been shown to give better out-of-sample predictive performance than any single selected model, on average (Raftery et al., 1997; Hoeting et al., 1999).
- Honest uncertainty. Intervals include model uncertainty, so they are less likely to be too narrow.
- Calibrated forecast combination. Raftery et al. (2005) used BMA to combine an ensemble of weather forecasts into a calibrated predictive distribution, an approach that transfers to combining demand or sales forecasts.
- Many candidate drivers. In cross-country growth regressions with dozens of possible determinants, Fernández et al. (2001) used BMA to identify which variables were robustly related to growth.
Practical guidance and limitations
- Priors matter. Results can be sensitive to prior choices for both models and parameters, especially in small samples. Report the priors and check sensitivity to them.
- The true model may be absent. BMA weights assume that one of the candidates is correct. When all models are approximations, stacking of predictive distributions can give better predictions (Yao et al., 2018).
- Large model spaces need search. With 30 predictors there are over a billion possible models, so sampling or search algorithms are used to explore them.
- Report the model space, not just the average. Readers should see which candidate models were considered, their posterior probabilities and each predictor's inclusion probability, as in Figure 1. A single averaged coefficient without this context hides the very uncertainty the method is meant to reveal.
- Weights are not causal evidence. A high inclusion probability means a variable helps predict the outcome, not that changing it would change the outcome.
Key takeaways
Bayesian model averaging turns model uncertainty from a hidden problem into a reported quantity. It combines the evidence from all plausible models, gives better-calibrated predictions and intervals, and shows clearly which drivers are well supported and which are not. For survey and business analysis with many candidate drivers, it is a disciplined way to avoid overstating what the data can tell us.
References
Draper, D. (1995). Assessment and propagation of model uncertainty. Journal of the Royal Statistical Society Series B: Statistical Methodology, 57(1), 45–97. https://doi.org/10.1111/j.2517-6161.1995.tb02015.x
Fernández, C., Ley, E., & Steel, M. F. J. (2001). Model uncertainty in cross-country growth regressions. Journal of Applied Econometrics, 16(5), 563–576. https://doi.org/10.1002/jae.623
Hoeting, J. A., Madigan, D., Raftery, A. E., & Volinsky, C. T. (1999). Bayesian model averaging: A tutorial. Statistical Science, 14(4), 382–417. https://doi.org/10.1214/ss/1009212519
Kass, R. E., & Raftery, A. E. (1995). Bayes factors. Journal of the American Statistical Association, 90(430), 773–795. https://doi.org/10.1080/01621459.1995.10476572
Raftery, A. E., Gneiting, T., Balabdaoui, F., & Polakowski, M. (2005). Using Bayesian model averaging to calibrate forecast ensembles. Monthly Weather Review, 133(5), 1155–1174. https://doi.org/10.1175/MWR2906.1
Raftery, A. E., Madigan, D., & Hoeting, J. A. (1997). Bayesian model averaging for linear regression models. Journal of the American Statistical Association, 92(437), 179–191. https://doi.org/10.1080/01621459.1997.10473615
Yao, Y., Vehtari, A., Simpson, D., & Gelman, A. (2018). Using stacking to average Bayesian predictive distributions (with discussion). Bayesian Analysis, 13(3), 917–1007. https://doi.org/10.1214/17-BA1091