
Research · Research design
Longitudinal Research: Cohort, Panel and Trend Studies
How longitudinal research measures change over time, the differences between trend, cohort and panel designs, famous long-running studies, the problems of attrition, conditioning and separating age, period and cohort effects, and how organisations can use longitudinal data.
Most research takes a single snapshot: a survey is fielded, the data are analysed and the results describe a moment in time. Longitudinal research collects data on the same topic at two or more points in time, so that change can be measured directly. It answers questions that snapshots cannot: whether customer satisfaction is rising or falling, how individuals' circumstances change as they age, whether people who adopt a product early remain loyal, and what happens before and after a major event. Menard (2002) defines longitudinal research as research in which data are collected for each variable at two or more distinct periods, the subjects or cases analysed are the same or comparable from one period to the next, and the analysis involves some comparison of data between or among periods. This article explains the three main longitudinal designs (trend, cohort and panel studies), describes some of the long-running studies that have shaped knowledge in health and social science, and sets out the problems that make longitudinal research difficult and the methods used to address them.
Why time matters
A cross-sectional survey can show that older customers are more satisfied than younger ones. It cannot show whether customers become more satisfied as they age, whether older customers have always been more satisfied because they grew up in a different era, or whether dissatisfied older customers have already left. Each of these explanations has different implications, and only data collected over time can distinguish between them.
Longitudinal data serve three main purposes. They describe change, showing how a measure moves over time for a population or for individuals. They help establish temporal order, because a cause must precede its effect; observing that a change in one variable came before a change in another is evidence, though not proof, of a causal relationship (Shadish et al., 2002). And they allow researchers to study individual trajectories, showing not only that the average changed but which individuals changed, by how much and why (Singer & Willett, 2003).
Three designs
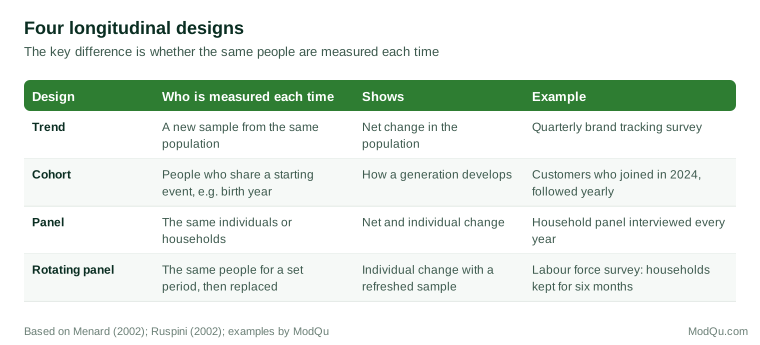
Longitudinal designs differ mainly in whether the same individuals are measured at each point, or merely comparable samples from the same population.
Trend studies
A trend study surveys a fresh sample from the same population at each time point. The same questions are asked, so the results can be compared, but different people answer each time. Many of the best-known social indicators are trend studies. National labour force surveys, consumer confidence indices and repeated social attitude surveys draw new samples regularly and track how the population changes.
Trend studies show net change in a population: the share of people holding a view or engaging in a behaviour at each point. They cannot show gross change, the movement of individuals. If support for a policy is 50% in two successive years, it may be that no one changed their mind or that a quarter of the population switched in each direction. Only data on the same individuals can tell the two apart. Trend studies are also affected by changes in the population itself: the population surveyed this year includes people who were too young to be included a decade ago and excludes those who have died or moved away.
Cohort studies
A cohort is a group of people who experience the same event in the same period, most often birth, but also entering a school, starting a job, getting married or becoming a customer. Ryder (1965) argued that cohorts are central to understanding social change, because each cohort experiences historical events at a different age and carries the effects of those experiences forward.
The term "cohort study" is used in two ways. In demography and sociology, it can mean following the same cohort through successive samples, which need not include the same individuals: a researcher might compare people born in 1980 at ages 20, 30 and 40 using three separate surveys. In medicine and epidemiology, it usually means following the same individuals from a defined starting point, which makes it a form of panel study.
Some of the most important studies in health research are cohort studies of this second kind. The Framingham Heart Study, begun in 1948 in a town in Massachusetts, followed more than 5,000 adults with regular examinations to identify factors associated with heart disease (Dawber et al., 1951). It helped establish high blood pressure, high cholesterol and smoking as major risk factors. The British Doctors Study followed about 34,000 male doctors from 1951 and documented the effects of smoking on mortality over 50 years (Doll et al., 2004). Britain's 1946 birth cohort, the MRC National Survey of Health and Development, has followed a sample of people born in one week in March 1946 throughout their lives (Wadsworth et al., 2006). New Zealand's Dunedin study has followed about 1,000 people born in 1972–1973 from birth into middle age, with very high retention (Poulton et al., 2015).
Cohort studies have also been influential in sociology. Elder (1974) used data from a study of children born in Oakland, California, in the early 1920s to show how the Great Depression shaped their later lives, and how its effects depended on their families' losses and on their age when hardship struck.
Panel studies
A panel study measures the same individuals, households or organisations repeatedly. Lazarsfeld et al. (1944) used one of the earliest survey panels in their study of the 1940 United States presidential election, interviewing the same voters in Erie County, Ohio, several times during the campaign to see how and why they changed their intentions. Panels are now used for long-running household surveys, such as the Panel Study of Income Dynamics in the United States and the national household panel surveys of many other countries, as well as for commercial purposes, such as consumer purchase panels and online research panels that track the same respondents over time.
Panels offer the richest information. Because the same people are measured repeatedly, they show gross change as well as net change, reveal who changes and who does not, and allow researchers to study the timing and sequence of events in individual lives. Kalton and Citro (1993) called the panel survey the addition of a "fourth dimension" to survey research. Panels also allow powerful statistical methods. Because each person is compared with themselves at different times, characteristics that do not change, such as genetic make-up or upbringing, are automatically controlled. Halaby (2004) and Wooldridge (2010) describe how fixed-effects models use this feature to remove the influence of stable unmeasured characteristics, a major advantage over cross-sectional analysis.
A common variant is the rotating panel, in which part of the sample is replaced at each round. Many labour force surveys follow households for a set number of months before replacing them. This balances the benefits of following individuals against the burdens on respondents and the risk that a long-serving sample becomes unrepresentative.
The difficulties of longitudinal research
Longitudinal research is demanding. It takes time, requires sustained funding and organisation, and faces several methodological problems that do not arise in single snapshots.
Attrition
Panel members drop out. Some move and cannot be traced, some decline to continue and some die. This attrition reduces the sample size and, more seriously, can bias the results if those who leave differ from those who stay. Fitzgerald et al. (1998) examined the Panel Study of Income Dynamics, which had lost about half of its original sample after two decades, and found that attrition was concentrated among people with lower earnings and less stable lives. Fortunately, in that case, the remaining sample still produced estimates broadly similar to those from other sources, partly because the study had been designed with attrition in mind.
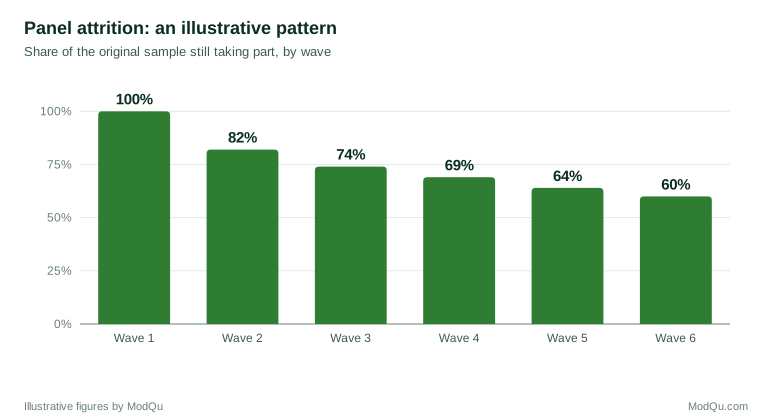
Attrition is usually highest between the first and second waves and then slows. Lugtig (2014) showed that panel members follow distinct patterns: some stay throughout, some leave quickly, some drift away gradually and some participate intermittently. Each pattern has different causes and calls for a different response. Laurie et al. (1999) described strategies for reducing attrition in the British Household Panel Survey, including keeping in touch between waves, tracing people who move, offering incentives and using the same interviewer where possible. Weighting adjustments can compensate partly for those who leave, but only to the extent that the reasons for leaving are related to characteristics the study has measured.
Panel conditioning
Taking part in a panel can change people. Being asked about a subject may make respondents think about it more, seek out information or change their behaviour. Respondents may also learn how to answer: for example, discovering that answering "yes" to a filter question leads to many follow-up questions, and answering "no" in later waves to save time. Warren and Halpern-Manners (2012) reviewed evidence on such panel conditioning and found that it varies widely by topic: effects are strongest when questions concern subjects respondents have not thought much about, or when answering particular ways has consequences for the length of the interview. Comparing long-standing panel members with new entrants, as rotating designs allow, is one way to detect conditioning.
Measurement change
Over long periods, questions, definitions and methods change. A question that made sense in 1990 may need updating, and a change from face-to-face to online interviewing can alter how people answer. Each change risks creating an apparent shift in the data that reflects the method rather than the world. Lynn (2009) describes the trade-offs involved in keeping measures consistent while keeping them relevant. A common solution is to run old and new versions side by side for a period, so that the effect of the change can be estimated.
Separating age, period and cohort
When a measure changes over time, three kinds of explanation are possible. An age effect is a change that occurs as people grow older, regardless of when they were born. A period effect affects everyone at a particular time, such as a recession or a pandemic. A cohort effect is a lasting difference between groups born at different times, reflecting their formative experiences.
These three cannot be separated by simple analysis, because any one is determined by the other two: a person's age equals the current year minus their birth year. Mason et al. (1973) set out this identification problem and proposed approaches that rely on additional assumptions. Glenn (2005) cautioned that no statistical technique can solve the problem without such assumptions, and that researchers must justify them using theory and evidence from outside the data. Yang and Land (2013) describe more recent models that impose structured assumptions to estimate the three effects.
The problem has practical consequences. Claims about generational differences in the workplace are often based on cross-sectional comparisons of younger and older workers, which confound age with cohort. Twenge et al. (2010) used a trend design, comparing high school seniors surveyed in 1976, 1991 and 2006, which held age constant and allowed differences between cohorts to be estimated. They found some differences in work values, such as an increased value placed on leisure. Costanza et al. (2012), in a meta-analysis of studies comparing generations, found that differences in job satisfaction, organisational commitment and intention to leave were generally small and inconsistent, and argued that many apparent generational differences reflect age or career stage.
Designing a longitudinal study
Several design decisions shape what a longitudinal study can show, and most of them must be made before the first wave, because they are hard to change later.
Length and spacing of waves. The interval between measurements should match the speed of the change being studied. Monthly measurement suits fast-moving outcomes such as purchase intentions during a campaign; annual or less frequent measurement suits slower processes such as career development or health. Ruspini (2002) notes that intervals that are too long can miss short-lived changes entirely, while intervals that are too short add cost and burden without adding information.
Number of waves. Two waves can show whether change occurred, but they cannot distinguish a steady trend from a temporary fluctuation, and they confound true change with measurement error. Singer and Willett (2003) recommend at least three waves for studying individual change, and more when the shape of the trajectory matters, for example whether satisfaction declines steadily or falls sharply and then levels off.
Sample size. Because attrition accumulates, the initial sample must be large enough that the sample remaining at the final wave can still answer the research question. If a study expects to retain 60% of its members after five waves and needs 1,200 at the end, it must start with at least 2,000, and more if the analysis will compare subgroups.
Retrospective questions. When a prospective study is not possible, researchers sometimes ask people to recall their past circumstances in a single survey. This is cheaper and faster, but recall is imperfect: people misremember the timing of events, forget minor ones and reinterpret the past in the light of the present. Groves et al. (2009) describe how such recall errors grow with the length of the reference period and with the ordinariness of the events being recalled. Retrospective questions are most reliable for memorable events, such as moving house or changing jobs, and least reliable for attitudes or routine behaviour.
Linking records. Many studies now link survey responses to administrative or transaction records, with participants' consent. Linked records can provide accurate, continuous measures of outcomes such as earnings, health service use or purchases between survey waves, reducing respondent burden and filling gaps left by attrition.
Analysing longitudinal data
Longitudinal data call for analysis methods that respect their structure. Observations from the same person are not independent, so standard methods that assume independence will understate uncertainty. Singer and Willett (2003) describe two broad families of methods. Growth models describe how an outcome changes over time for each individual and what explains differences in these trajectories, for example why some customers' spending rises steadily while others' declines. Event history or survival models analyse whether and when an event occurs, such as cancelling a subscription, changing jobs or making a first purchase, while accounting for people whose event has not yet occurred when observation ends. Fixed-effects and related panel models, as noted above, use the repeated measures to control for stable unmeasured characteristics (Wooldridge, 2010).
Longitudinal research in business
Organisations generate longitudinal data continuously. Transaction records, account histories and website logs track the same customers over time, and many organisations run tracking surveys that measure brand awareness, satisfaction or employee engagement at regular intervals.
The distinctions described in this article apply directly. A tracking study that draws a new sample each quarter is a trend study. It shows whether overall satisfaction is rising or falling, but not which customers changed or why. A customer panel that surveys the same customers repeatedly shows individual change and can link it to experiences in between, such as a complaint or a price rise, but it must manage attrition and conditioning. A cohort analysis that groups customers by the month they joined and tracks their retention and spending over time is a standard tool for understanding whether newer customers behave differently from older ones, separating the effect of customer tenure (an age effect) from changes in the business environment (a period effect) and differences in who was recruited (a cohort effect).
Several practical guidelines follow from the research discussed here.
- Keep the core questions and methods stable. Changes to wording, scales or data collection methods should be made rarely, documented and, where possible, tested in parallel with the old version.
- Plan for attrition. Panels should collect contact information, keep in touch between waves, and record enough about each member to adjust for those who leave.
- Refresh the sample. Long-running panels should add new members periodically so that they continue to represent the current population and so that conditioning can be checked.
- Interpret change carefully. An apparent trend may reflect a change in methods, a change in who is being measured, or the separate effects of age, period and cohort.
Conclusion
Longitudinal research measures change directly, establishes the order of events and reveals how individuals develop over time. Trend studies show how populations change; cohort studies show how groups that share a formative experience develop; panel studies show how individuals change and allow powerful controls for stable characteristics. In return, longitudinal research demands patience, consistent methods and sustained effort to keep participants involved. The studies that have met these demands, from Framingham to the national birth cohorts, have produced knowledge that no snapshot could provide.
References
Costanza, D. P., Badger, J. M., Fraser, R. L., Severt, J. B., & Gade, P. A. (2012). Generational differences in work-related attitudes: A meta-analysis. Journal of Business and Psychology, 27(4), 375–394. https://doi.org/10.1007/s10869-012-9259-4
Dawber, T. R., Meadors, G. F., & Moore, F. E., Jr. (1951). Epidemiological approaches to heart disease: The Framingham Study. American Journal of Public Health, 41(3), 279–286. https://doi.org/10.2105/AJPH.41.3.279
Doll, R., Peto, R., Boreham, J., & Sutherland, I. (2004). Mortality in relation to smoking: 50 years' observations on male British doctors. BMJ, 328(7455), Article 1519. https://doi.org/10.1136/bmj.38142.554479.AE
Elder, G. H., Jr. (1974). Children of the Great Depression: Social change in life experience. University of Chicago Press.
Fitzgerald, J., Gottschalk, P., & Moffitt, R. (1998). An analysis of sample attrition in panel data: The Michigan Panel Study of Income Dynamics. Journal of Human Resources, 33(2), 251–299. https://doi.org/10.2307/146433
Glenn, N. D. (2005). Cohort analysis (2nd ed.). SAGE. https://doi.org/10.4135/9781412983662
Groves, R. M., Fowler, F. J., Jr., Couper, M. P., Lepkowski, J. M., Singer, E., & Tourangeau, R. (2009). Survey methodology (2nd ed.). Wiley.
Halaby, C. N. (2004). Panel models in sociological research: Theory into practice. Annual Review of Sociology, 30, 507–544. https://doi.org/10.1146/annurev.soc.30.012703.110629
Kalton, G., & Citro, C. F. (1993). Panel surveys: Adding the fourth dimension. Survey Methodology, 19(2), 205–215.
Laurie, H., Smith, R., & Scott, L. (1999). Strategies for reducing nonresponse in a longitudinal panel survey. Journal of Official Statistics, 15(2), 269–282.
Lazarsfeld, P. F., Berelson, B., & Gaudet, H. (1944). The people's choice: How the voter makes up his mind in a presidential campaign. Duell, Sloan and Pearce.
Lugtig, P. (2014). Panel attrition: Separating stayers, fast attriters, gradual attriters, and lurkers. Sociological Methods & Research, 43(4), 699–723. https://doi.org/10.1177/0049124113520305
Lynn, P. (Ed.). (2009). Methodology of longitudinal surveys. Wiley. https://doi.org/10.1002/9780470743874
Mason, K. O., Mason, W. M., Winsborough, H. H., & Poole, W. K. (1973). Some methodological issues in cohort analysis of archival data. American Sociological Review, 38(2), 242–258. https://doi.org/10.2307/2094398
Menard, S. (2002). Longitudinal research (2nd ed.). SAGE. https://doi.org/10.4135/9781412984867
Poulton, R., Moffitt, T. E., & Silva, P. A. (2015). The Dunedin Multidisciplinary Health and Development Study: Overview of the first 40 years, with an eye to the future. Social Psychiatry and Psychiatric Epidemiology, 50(5), 679–693. https://doi.org/10.1007/s00127-015-1048-8
Ruspini, E. (2002). Introduction to longitudinal research. Routledge.
Ryder, N. B. (1965). The cohort as a concept in the study of social change. American Sociological Review, 30(6), 843–861. https://doi.org/10.2307/2090964
Shadish, W. R., Cook, T. D., & Campbell, D. T. (2002). Experimental and quasi-experimental designs for generalized causal inference. Houghton Mifflin.
Singer, J. D., & Willett, J. B. (2003). Applied longitudinal data analysis: Modeling change and event occurrence. Oxford University Press. https://doi.org/10.1093/acprof:oso/9780195152968.001.0001
Twenge, J. M., Campbell, S. M., Hoffman, B. J., & Lance, C. E. (2010). Generational differences in work values: Leisure and extrinsic values increasing, social and intrinsic values decreasing. Journal of Management, 36(5), 1117–1142. https://doi.org/10.1177/0149206309352246
Wadsworth, M., Kuh, D., Richards, M., & Hardy, R. (2006). Cohort profile: The 1946 National Birth Cohort (MRC National Survey of Health and Development). International Journal of Epidemiology, 35(1), 49–54. https://doi.org/10.1093/ije/dyi201
Warren, J. R., & Halpern-Manners, A. (2012). Panel conditioning in longitudinal social science surveys. Sociological Methods & Research, 41(4), 491–534. https://doi.org/10.1177/0049124112460374
Wooldridge, J. M. (2010). Econometric analysis of cross section and panel data (2nd ed.). MIT Press.
Yang, Y., & Land, K. C. (2013). Age-period-cohort analysis: New models, methods, and empirical applications. CRC Press. https://doi.org/10.1201/b13902