
Research · Research design
A/B Testing as Applied Experimental Research
How A/B testing applies the logic of the randomised experiment to products, websites and marketing, the steps in a sound test, the statistical and practical pitfalls that produce false results, and what online experiments can and cannot show.
An A/B test is a randomised experiment run on a live product or service. Users are randomly assigned to see one of two or more versions, such as the current checkout page (A) and a redesigned one (B), and their behaviour is compared. The term comes from web development and marketing, but the method is the same one Fisher (1935) described for agricultural trials and that medicine adopted for clinical trials: random assignment, a control condition and a pre-specified outcome. What is new is the scale and speed. Large technology companies now run thousands of experiments a year, and many smaller organisations use testing tools to compare web pages, emails and prices. This article explains A/B testing as a form of experimental research, the steps involved in running a test well, the most common errors, and the limits of what such tests can show.
The experimental logic
An A/B test answers a causal question: if this change were made for everyone, how would behaviour differ? Rubin (1974) framed such questions in terms of potential outcomes. Each user has an outcome they would produce under version A and another they would produce under version B, but only one can be observed. Random assignment solves the problem at the group level. Because chance alone decides which version each user sees, the two groups are alike, on average, in every respect except the version, so the difference in their average outcomes estimates the effect of the change.
This is what distinguishes an A/B test from other uses of data. Comparing users who chose a new feature with users who did not, or comparing sales before and after a redesign, can be misleading, because users who opt in differ from those who do not, and many things change over time. Kohavi et al. (2009) gave the example of a feature that appears to be associated with lower engagement simply because users who encounter errors are more likely to see it. Randomisation removes such confounding.
A/B tests are also a particular kind of field experiment. They take place in the real setting, with real users making real decisions, usually without being aware of the test. Gerber and Green (2012) argue that this combination of randomisation and realism is the field experiment's main advantage over both laboratory studies and observational analysis.
Why organisations test
Kohavi and Thomke (2017) describe how experiments repeatedly overturn expert expectations. At Bing, Microsoft's search engine, a small change to the way advertisement headlines were displayed, which had been waiting in a backlog for months because no one expected much from it, increased revenue by about 12%. At the same time, many changes that teams were confident about produced no improvement or made things worse. Across companies with mature testing programmes, they report, only a minority of ideas improve the metrics they were designed to improve.
Thomke (2020) argues that the main value of experimentation is therefore organisational. It replaces arguments based on opinion, seniority or intuition with evidence, and it allows many small ideas to be tried cheaply, so that the few that work can be found. Kohavi et al. (2013) describe how this works at scale, with hundreds of concurrent experiments running on the same product.
Running a sound test
A reliable A/B test follows a sequence of steps, each of which guards against a particular kind of error.
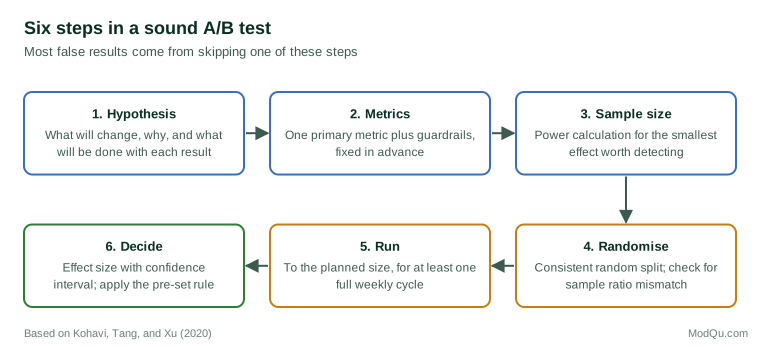
1. State the hypothesis and the decision
A test should begin with a specific hypothesis, such as "showing delivery costs on the product page will increase completed purchases because it removes a surprise at checkout", and a statement of what will be done with each possible result. Writing these down in advance prevents the common situation in which a test is run without a clear question and its results are interpreted to fit whatever happened.
2. Choose the metrics
Every test needs a primary metric, the outcome on which the decision will be based, chosen before the test starts. Kohavi, Tang, and Xu (2020) recommend that this be an overall evaluation criterion that reflects long-term value, not just immediate clicks. A change that increases clicks on an advertisement but annoys users may reduce long-term engagement. Tests should also track guardrail metrics, such as page load time, error rates and cancellations, that should not get worse, so that a gain on the primary metric is not bought at an unacceptable cost elsewhere.
3. Decide the sample size in advance
A test must be large enough to detect an effect of the size that would matter. This is a question of statistical power: the probability that a test will detect a real effect of a given size (Cohen, 1988). Power depends on the size of the effect, the variability of the outcome and the number of users. Small effects on rare outcomes require very large samples.
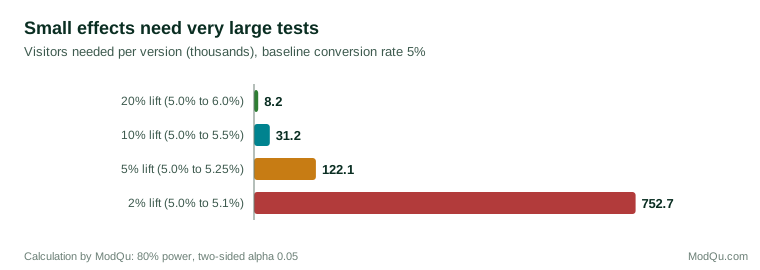
The figure illustrates why. When only 5% of visitors buy, detecting a 20% relative improvement (from 5.0% to 6.0%) requires about 8,200 visitors per version. Detecting a 5% relative improvement (from 5.0% to 5.25%) requires about 122,000 per version, and a 2% improvement requires roughly 750,000. Many organisations do not have that much traffic, which means many tests of small changes are too small to give a reliable answer. Deng et al. (2013) showed that using data on users' behaviour before the experiment to adjust the analysis can reduce the required sample size substantially, a technique now widely used.
4. Randomise properly and check it worked
Assignment should be random, consistent, so that a returning user sees the same version, and independent of anything that might affect the outcome. One of the most useful checks is the sample ratio mismatch test. If a test is designed to split users 50/50 but the observed split is, for example, 50.8/49.2 on a large sample, something has gone wrong: perhaps one version loads more slowly and some users leave before being counted, or a bug excludes some users from one group. Fabijan et al. (2019) found that such mismatches are common in practice and usually signal a problem that makes the results untrustworthy.
5. Run for the planned duration
A test should run until it reaches its planned sample size, and for at least one full business cycle, usually a week, so that weekday and weekend users are both represented. Stopping early is one of the most common errors, discussed below.
6. Analyse and decide
At the end of the test, the difference between versions is estimated with a confidence interval, and a decision is made according to the rules set at the start. The analysis should report the size of the effect and the uncertainty around it, not only whether it was statistically significant. Wasserstein and Lazar (2016), writing for the American Statistical Association, stressed that a p-value does not measure the size or importance of an effect, and that decisions should not rest on whether it crosses a single threshold.
Beyond two versions
The simple two-version test has several extensions.
- A/B/n tests compare a control with several alternatives at once. They make better use of traffic than a series of separate tests but require adjustment for the larger number of comparisons.
- Multivariate or factorial tests vary several elements independently, such as the headline, the image and the button, so that each combination is shown to some users. Box et al. (2005) describe how factorial designs estimate the effect of each factor and reveal whether factors interact, for instance whether a new headline works only with a particular image. The cost is that each combination receives fewer users, so factorial tests need high traffic.
- Multi-armed bandit methods shift traffic during the test towards the versions that appear to be performing best. They reduce the cost of showing users a poor version and suit short-lived decisions, such as which headline to show on a news story. They are less suited to measuring the size of an effect precisely, because the allocation changes as the data arrive.
- Holdout groups keep a small percentage of users on the old experience for months after a change is launched, so that its long-term effect can be measured.
Kohavi, Tang, Xu, et al. (2020) note that many of these practices, developed for websites, have parallels in medicine, where large pragmatic trials and adaptive designs face similar trade-offs between speed, precision and the cost of exposing participants to an inferior treatment. The underlying principle is the same in every variation: whatever the allocation scheme, it must be decided by a random process that the people being studied cannot influence.
Common pitfalls
Peeking and early stopping
Many testing tools display results continuously, and it is tempting to stop a test as soon as it shows a significant difference. This greatly increases the rate of false positives, because random fluctuations early in a test often cross the significance threshold before settling down. Johari et al. (2017) showed that repeatedly checking a standard test and stopping when it first appears significant can raise the false positive rate from the nominal 5% to well over 30%. Their solution, now used in several commercial testing platforms, is a form of sequential testing that remains valid however often the results are checked. The simpler alternative is to fix the sample size in advance and not act on interim results.
Testing many things at once
A test that tracks twenty metrics, or compares results across ten customer segments, will often find a "significant" difference somewhere by chance. Simmons et al. (2011) showed how flexibility in choosing which outcomes and subgroups to report can produce false positive findings even when each individual choice seems reasonable. The remedies are to name the primary metric in advance, treat other results as exploratory, and where many comparisons are made, adjust for them, for example by controlling the false discovery rate (Benjamini & Hochberg, 1995).
The winner's curse
When many tests are run and only the significant ones are acted on, the measured effects of the winners tend to be overestimated, because the tests that happened to show large effects by chance are more likely to pass the threshold. The practical consequence is that the gains from a series of winning tests, when added together, are usually larger than the actual improvement in business results. Replicating important results, or holding back a small control group after launch, provides a more realistic estimate.
Novelty and short-term effects
Users may react to a change simply because it is new. A redesigned button may attract clicks at first and then lose its effect as users become accustomed to it. Conversely, a change that users dislike at first may perform better once they adjust. Hohnhold et al. (2015) described long-running experiments at Google showing that increasing the number of advertisements raised short-term revenue but gradually reduced how often users clicked on advertisements at all, so that the long-term effect was much smaller than the short-term one. Tests of changes that might have delayed effects need to run longer, or include a long-term holdout group.
Interference between users
The standard analysis assumes that one user's treatment does not affect another user's outcome. This assumption fails on marketplaces and social networks, where users interact. If a ride-sharing service tests lower prices on half its riders, the treated riders may take drivers away from the control riders, making the control group's experience worse and exaggerating the apparent effect. Bakshy et al. (2014) describe designs that randomise at the level of groups, such as regions or clusters of connected users, to reduce such interference.
Measuring advertising
A/B testing has had a large effect on how advertising is evaluated. Lewis and Rao (2015) analysed 25 large advertising field experiments and showed that, because individual purchases vary so much, even campaigns with millions of exposures often cannot measure their own return with useful precision. Blake et al. (2015) ran experiments at eBay in which paid search advertising was switched off in some regions. For well-known brands, most of the traffic from paid search advertisements would have arrived anyway through unpaid search results, so the returns were much lower than the company's previous non-experimental estimates suggested. Gordon et al. (2019) compared the results of large advertising experiments at Facebook with estimates from common observational methods applied to the same campaigns, and found that the observational methods often overstated the effects, sometimes by a large margin. These studies show how far conclusions based on correlation can diverge from those based on randomised comparison.
Ethics
Because A/B tests are usually run without users' knowledge, they raise questions about consent. The issue drew wide attention when Kramer et al. (2014) reported an experiment in which Facebook altered the emotional content of the news feeds of about 690,000 users to see whether it affected the emotional tone of their own posts. Critics objected that users had not consented to having their emotions manipulated.
Meyer (2015) argued that the controversy reflected what she called the "A/B illusion": people tend to object to an experiment that compares two practices while accepting the imposition of either practice on everyone without testing. Since organisations constantly change their products, testing changes before rolling them out may often be more responsible than not testing. Her argument does not remove the need for judgement. Tests that could cause harm, that involve sensitive matters such as health, finances or emotions, or that deceive users in ways they would object to, deserve ethical review comparable to that applied to other research with human participants.
What A/B tests can and cannot show
A/B tests are very good at answering one kind of question: which of these versions produces a better result on this metric, for these users, over this period? They are less suited to other questions.
- They show what works, not why. A test may show that a new design increases sales without revealing which element caused the increase or what users thought. Qualitative research, such as usability testing and interviews, is needed to explain results and generate better ideas.
- They test only the options proposed. A test compares the versions someone thought to build. It cannot reveal a better option no one considered.
- They work best for small, frequent decisions. Major strategic choices, such as entering a new market or repositioning a brand, usually cannot be tested on a fraction of users for a few weeks.
- They need traffic. Organisations with modest numbers of users often cannot detect realistic effects within a reasonable time, and are better served by testing larger changes or by other research methods.
- Results apply to the conditions tested. An effect measured in a particular season, market or user base may not hold elsewhere.
Box et al. (2005) describe experimentation as an iterative process in which each experiment informs the design of the next. A/B testing fits this description best when it is one part of a programme of research that also includes exploratory work to understand users and generate hypotheses, and careful analysis to understand why winning changes work.
Conclusion
A/B testing is the randomised experiment adapted to the speed and scale of digital products. Its strength is the same as that of any well-run experiment: random assignment allows a difference in outcomes to be attributed to the change being tested. Its weaknesses come mostly from how it is practised. Tests that are too small, stopped too early, analysed on too many metrics or run for too short a time produce confident-looking results that do not hold up. Organisations that pre-specify their hypotheses and metrics, plan their sample sizes, check that randomisation worked and treat surprising results with caution can use A/B testing to learn reliably what their customers respond to.
References
Bakshy, E., Eckles, D., & Bernstein, M. S. (2014). Designing and deploying online field experiments. In Proceedings of the 23rd International Conference on World Wide Web (pp. 283–292). Association for Computing Machinery. https://doi.org/10.1145/2566486.2567967
Benjamini, Y., & Hochberg, Y. (1995). Controlling the false discovery rate: A practical and powerful approach to multiple testing. Journal of the Royal Statistical Society: Series B (Methodological), 57(1), 289–300. https://doi.org/10.1111/j.2517-6161.1995.tb02031.x
Blake, T., Nosko, C., & Tadelis, S. (2015). Consumer heterogeneity and paid search effectiveness: A large-scale field experiment. Econometrica, 83(1), 155–174. https://doi.org/10.3982/ECTA12423
Box, G. E. P., Hunter, J. S., & Hunter, W. G. (2005). Statistics for experimenters: Design, innovation, and discovery (2nd ed.). Wiley.
Cohen, J. (1988). Statistical power analysis for the behavioral sciences (2nd ed.). Lawrence Erlbaum Associates.
Deng, A., Xu, Y., Kohavi, R., & Walker, T. (2013). Improving the sensitivity of online controlled experiments by utilizing pre-experiment data. In Proceedings of the Sixth ACM International Conference on Web Search and Data Mining (pp. 123–132). Association for Computing Machinery. https://doi.org/10.1145/2433396.2433413
Fabijan, A., Gupchup, J., Gupta, S., Omhover, J., Qin, W., Vermeer, L., & Dmitriev, P. (2019). Diagnosing sample ratio mismatch in online controlled experiments: A taxonomy and rules of thumb for practitioners. In Proceedings of the 25th ACM SIGKDD International Conference on Knowledge Discovery & Data Mining (pp. 2156–2164). Association for Computing Machinery. https://doi.org/10.1145/3292500.3330722
Fisher, R. A. (1935). The design of experiments. Oliver and Boyd.
Gerber, A. S., & Green, D. P. (2012). Field experiments: Design, analysis, and interpretation. W. W. Norton.
Gordon, B. R., Zettelmeyer, F., Bhargava, N., & Chapsky, D. (2019). A comparison of approaches to advertising measurement: Evidence from big field experiments at Facebook. Marketing Science, 38(2), 193–225. https://doi.org/10.1287/mksc.2018.1135
Hohnhold, H., O'Brien, D., & Tang, D. (2015). Focusing on the long-term: It's good for users and business. In Proceedings of the 21th ACM SIGKDD International Conference on Knowledge Discovery and Data Mining (pp. 1849–1858). Association for Computing Machinery. https://doi.org/10.1145/2783258.2788583
Johari, R., Koomen, P., Pekelis, L., & Walsh, D. (2017). Peeking at A/B tests: Why it matters, and what to do about it. In Proceedings of the 23rd ACM SIGKDD International Conference on Knowledge Discovery and Data Mining (pp. 1517–1525). Association for Computing Machinery. https://doi.org/10.1145/3097983.3097992
Kohavi, R., Deng, A., Frasca, B., Walker, T., Xu, Y., & Pohlmann, N. (2013). Online controlled experiments at large scale. In Proceedings of the 19th ACM SIGKDD International Conference on Knowledge Discovery and Data Mining (pp. 1168–1176). Association for Computing Machinery. https://doi.org/10.1145/2487575.2488217
Kohavi, R., Longbotham, R., Sommerfield, D., & Henne, R. M. (2009). Controlled experiments on the web: Survey and practical guide. Data Mining and Knowledge Discovery, 18(1), 140–181. https://doi.org/10.1007/s10618-008-0114-1
Kohavi, R., Tang, D., & Xu, Y. (2020). Trustworthy online controlled experiments: A practical guide to A/B testing. Cambridge University Press. https://doi.org/10.1017/9781108653985
Kohavi, R., Tang, D., Xu, Y., Hemkens, L. G., & Ioannidis, J. P. A. (2020). Online randomized controlled experiments at scale: Lessons and extensions to medicine. Trials, 21, Article 150. https://doi.org/10.1186/s13063-020-4084-y
Kohavi, R., & Thomke, S. (2017). The surprising power of online experiments. Harvard Business Review, 95(5), 74–82.
Kramer, A. D. I., Guillory, J. E., & Hancock, J. T. (2014). Experimental evidence of massive-scale emotional contagion through social networks. Proceedings of the National Academy of Sciences, 111(24), 8788–8790. https://doi.org/10.1073/pnas.1320040111
Lewis, R. A., & Rao, J. M. (2015). The unfavorable economics of measuring the returns to advertising. Quarterly Journal of Economics, 130(4), 1941–1973. https://doi.org/10.1093/qje/qjv023
Meyer, M. N. (2015). Two cheers for corporate experimentation: The A/B illusion and the virtues of data-driven innovation. Colorado Technology Law Journal, 13(2), 273–331.
Rubin, D. B. (1974). Estimating causal effects of treatments in randomized and nonrandomized studies. Journal of Educational Psychology, 66(5), 688–701. https://doi.org/10.1037/h0037350
Simmons, J. P., Nelson, L. D., & Simonsohn, U. (2011). False-positive psychology: Undisclosed flexibility in data collection and analysis allows presenting anything as significant. Psychological Science, 22(11), 1359–1366. https://doi.org/10.1177/0956797611417632
Thomke, S. H. (2020). Experimentation works: The surprising power of business experiments. Harvard Business Review Press.
Wasserstein, R. L., & Lazar, N. A. (2016). The ASA statement on p-values: Context, process, and purpose. The American Statistician, 70(2), 129–133. https://doi.org/10.1080/00031305.2016.1154108