
Research · Research design
Cross-Sectional Research: Uses and Limitations
What cross-sectional research is, why it is the most widely used design in survey and market research, what it can and cannot show, the main sources of error, and practical ways to get more from a single snapshot.
A cross-sectional study collects data from a sample of people, organisations or other units at a single point in time. It is the most common design in social, health and market research. A national health survey, an employee engagement survey, a customer satisfaction study and a poll of voting intentions are usually cross-sectional: each measures a set of characteristics once, across many units, and describes how those characteristics are distributed and related at that moment. de Vaus (2001) describes the cross-sectional design as one in which comparisons are made between groups at the same time rather than within the same group over time. This article explains what cross-sectional research does well, its main limitations, and how to design and interpret it so that its conclusions are sound.
What cross-sectional research is for
Cross-sectional studies answer three kinds of question well.
How common is something? The most direct use is to estimate prevalence: the proportion of a population with a characteristic, attitude or behaviour at a given time. What share of households own an electric vehicle? How many employees intend to leave within a year? What percentage of customers are aware of a new product? With a well-designed probability sample, a cross-sectional survey can answer such questions with known precision (Groves et al., 2009). In epidemiology, prevalence studies of this kind are a basic tool for planning health services (Levin, 2006).
How do groups differ? Cross-sectional data allow comparisons between groups defined by age, region, income, customer segment or any other characteristic measured at the same time. Such comparisons show where needs, opportunities or problems are concentrated.
Which characteristics go together? Cross-sectional data show associations between variables: whether customers who rate service highly also spend more, or whether employees with flexible schedules report less stress. These associations can suggest hypotheses and identify which relationships merit further investigation.
Setia (2016) and Wang and Cheng (2020) note several practical advantages. Cross-sectional studies are relatively quick and inexpensive, they can study many variables at once, they involve no follow-up, so there is no attrition, and they can be repeated at intervals to form a trend study.
The central limitation: time order
The main weakness of a cross-sectional study is that all variables are measured at the same time, so the study usually cannot show which came first. If customers who use a loyalty app spend more, it may be that the app encourages spending, that people who already spend more are more likely to download the app, or that both reflect a third factor such as whether a customer lives near a store. Shadish et al. (2002) identify the requirement that a cause precede its effect as one of three conditions for a causal claim, and cross-sectional data often cannot establish it.
This limitation matters for more than causal claims. Many questions are about processes that unfold over time: how attitudes develop, whether satisfaction leads to loyalty, or how a policy change affects behaviour. Maxwell and Cole (2007) showed that analyses of mediation, which test whether one variable affects another through a third, can be severely biased when all three are measured at the same time, because the analysis implicitly assumes that relationships observed at one moment reflect processes that occurred over time. Their simulations found that cross-sectional estimates could overstate, understate or even reverse the true longitudinal relationships.
Age, cohort and survival
A specific version of the time problem arises when cross-sectional data are used to infer how people change as they age. Suppose a survey finds that older customers are more loyal than younger ones. There are at least three explanations.
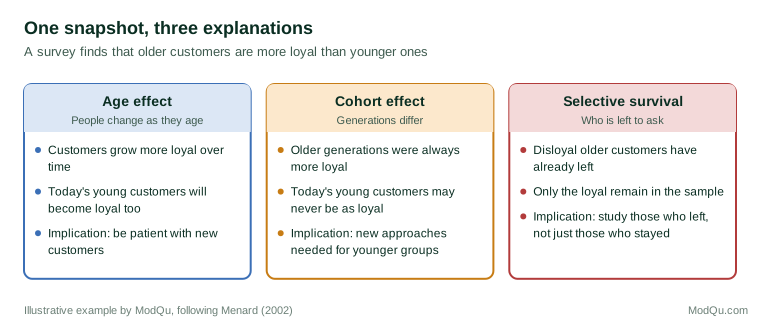
The difference could be an age effect: people become more loyal as they grow older. It could be a cohort effect: people who are older now grew up in a period when brand loyalty was more common, and they have always been more loyal. Or it could reflect selective survival: disloyal older customers have already left, so those who remain in the customer base are the loyal ones. A single cross-section cannot distinguish these explanations (Menard, 2002). Costanza et al. (2012) showed how claims about generational differences in the workplace often rest on cross-sectional comparisons that confuse age with cohort.
Selective survival is a form of selection bias: the sample at the time of measurement reflects a process that has already removed some units. Hernán et al. (2004) describe how such selection can create associations that do not exist in the full population, or hide those that do. It affects any cross-sectional study of a population that people enter and leave, such as current customers, current employees or people currently living with a condition.
Other sources of error
Common method variance
When all variables come from the same respondents, in the same questionnaire, at the same time, associations between them can be inflated by the measurement process itself. A respondent in a good mood may rate everything favourably; a respondent who wants to appear consistent may align answers across questions. Podsakoff et al. (2003) reviewed this common method variance and recommended remedies, including obtaining predictor and outcome measures from different sources, separating them in time or in the questionnaire, and using statistical checks. Lindell and Whitney (2001) proposed using a variable that should theoretically be unrelated to the others as a "marker" to estimate how much shared method inflates the correlations.
Ecological inference
Cross-sectional studies sometimes compare groups, such as regions or stores, rather than individuals. Robinson (1950) showed that correlations at the group level can differ greatly from correlations among individuals. Using 1930 United States census data, he found that states with more immigrants had higher literacy rates, even though immigrants were individually less likely to be literate, because immigrants tended to settle in states where literacy was already high. Conclusions about individuals should not be drawn from group-level data without strong additional evidence.
Sampling and non-response
Like any survey, a cross-sectional study is only as good as its sample. Kish (1965) set out the principles by which probability samples allow results to be generalised to a population with known precision. When samples are not drawn at random, or when many selected people do not respond, estimates of prevalence may be biased in ways that are difficult to detect from the data alone (Groves et al., 2009).
When cross-sectional data can support causal reasoning
The limitations of cross-sectional designs are real, but they are sometimes overstated. Spector (2019) argued that cross-sectional studies are often dismissed too readily, and that the key question is whether the design can rule out the specific alternative explanations that matter for a particular question. Several situations make cross-sectional data more informative.
- When time order is known. Some variables are clearly fixed before others: a person's country of birth precedes their current income, and a store's opening date precedes this year's sales. Rothman et al. (2008) note that in such cases, cross-sectional data can be analysed much like a cohort study.
- When the design includes an experiment. A cross-sectional survey can include randomly assigned variations, such as different product descriptions or prices shown to different respondents. The random assignment provides causal evidence within a single survey.
- When the causal structure is explicit. Pearl and Mackenzie (2018) show that if the researcher states the assumed relationships among variables, cross-sectional data can sometimes be used to estimate causal effects by adjusting for the right set of variables, provided the assumptions are correct.
- When retrospective questions are used carefully. Asking about past events, such as when a respondent first used a product, can establish a sequence, though recall is imperfect.
Rindfleisch et al. (2008) compared cross-sectional and longitudinal survey research in marketing and concluded that cross-sectional designs can be adequate when the constructs are concrete and the measures come from different sources or formats, but that longitudinal data are preferable when the relationships of interest involve processes unfolding over time.
An example: reading an employee survey
Consider an annual employee survey at a company with 3,000 staff (illustrative). It finds that employees who work from home at least two days a week report higher engagement scores than those who work in the office full time. Management is considering whether to expand remote work.
The cross-sectional finding is genuine and useful: it describes how engagement is distributed across work arrangements at the time of the survey. But it supports several interpretations. Remote work may increase engagement. Alternatively, more engaged and trusted employees may have been more likely to be granted remote arrangements in the first place. Employees in certain roles, which happen to be both more engaging and more suited to remote work, may be overrepresented among remote workers. And employees who disliked remote work may have already switched back to the office, or left.
Several steps would strengthen the conclusion without abandoning the survey. Comparing employees within the same role and team reduces confounding by job type. Asking when each employee's arrangement began, and linking survey responses to the previous year's results, would show whether engagement rose after the change or was already high. Using records of actual work location rather than self-reports would reduce shared method bias. And if the company goes ahead, introducing the change in stages, with some teams starting earlier than others, would provide a much stronger test.
Using cross-sectional research well
Several practices make cross-sectional studies more useful and their conclusions more defensible.
- Match the claim to the design. Report prevalence and associations as such. Use phrases such as "customers who use the app spend more" rather than "the app increases spending".
- Measure what came first. Include questions about the timing of key events, and use characteristics that were clearly fixed before the outcome as explanatory variables.
- Separate sources. Where possible, link survey responses to records, such as transaction data, so that predictors and outcomes do not share the same method.
- Think about who is missing. Consider whether the population at the time of measurement has been shaped by past departures, and if so, what that does to the comparisons.
- Repeat the study. Repeating a cross-sectional survey at regular intervals turns it into a trend study, showing how the population changes over time.
Conclusion
Cross-sectional research is efficient, flexible and essential for describing populations as they are. It estimates how common things are, how groups differ and which characteristics go together. Its central limitation is that it captures a single moment, so it usually cannot show how things change or what causes what. Used with that limitation in mind, and designed to rule out the most plausible alternative explanations, it remains the workhorse of survey and market research.
References
Costanza, D. P., Badger, J. M., Fraser, R. L., Severt, J. B., & Gade, P. A. (2012). Generational differences in work-related attitudes: A meta-analysis. Journal of Business and Psychology, 27(4), 375–394. https://doi.org/10.1007/s10869-012-9259-4
de Vaus, D. A. (2001). Research design in social research. SAGE.
Groves, R. M., Fowler, F. J., Jr., Couper, M. P., Lepkowski, J. M., Singer, E., & Tourangeau, R. (2009). Survey methodology (2nd ed.). Wiley.
Hernán, M. A., Hernández-Díaz, S., & Robins, J. M. (2004). A structural approach to selection bias. Epidemiology, 15(5), 615–625. https://doi.org/10.1097/01.ede.0000135174.63482.43
Kish, L. (1965). Survey sampling. Wiley.
Levin, K. A. (2006). Study design III: Cross-sectional studies. Evidence-Based Dentistry, 7(1), 24–25. https://doi.org/10.1038/sj.ebd.6400375
Lindell, M. K., & Whitney, D. J. (2001). Accounting for common method variance in cross-sectional research designs. Journal of Applied Psychology, 86(1), 114–121. https://doi.org/10.1037/0021-9010.86.1.114
Maxwell, S. E., & Cole, D. A. (2007). Bias in cross-sectional analyses of longitudinal mediation. Psychological Methods, 12(1), 23–44. https://doi.org/10.1037/1082-989X.12.1.23
Menard, S. (2002). Longitudinal research (2nd ed.). SAGE. https://doi.org/10.4135/9781412984867
Pearl, J., & Mackenzie, D. (2018). The book of why: The new science of cause and effect. Basic Books.
Podsakoff, P. M., MacKenzie, S. B., Lee, J.-Y., & Podsakoff, N. P. (2003). Common method biases in behavioral research: A critical review of the literature and recommended remedies. Journal of Applied Psychology, 88(5), 879–903. https://doi.org/10.1037/0021-9010.88.5.879
Rindfleisch, A., Malter, A. J., Ganesan, S., & Moorman, C. (2008). Cross-sectional versus longitudinal survey research: Concepts, findings, and guidelines. Journal of Marketing Research, 45(3), 261–279. https://doi.org/10.1509/jmkr.45.3.261
Robinson, W. S. (1950). Ecological correlations and the behavior of individuals. American Sociological Review, 15(3), 351–357. https://doi.org/10.2307/2087176
Rothman, K. J., Greenland, S., & Lash, T. L. (2008). Modern epidemiology (3rd ed.). Lippincott Williams & Wilkins.
Setia, M. S. (2016). Methodology series module 3: Cross-sectional studies. Indian Journal of Dermatology, 61(3), 261–264. https://doi.org/10.4103/0019-5154.182410
Shadish, W. R., Cook, T. D., & Campbell, D. T. (2002). Experimental and quasi-experimental designs for generalized causal inference. Houghton Mifflin.
Spector, P. E. (2019). Do not cross me: Optimizing the use of cross-sectional designs. Journal of Business and Psychology, 34(2), 125–137. https://doi.org/10.1007/s10869-018-09613-8
Wang, X., & Cheng, Z. (2020). Cross-sectional studies: Strengths, weaknesses, and recommendations. Chest, 158(1, Suppl.), S65–S71. https://doi.org/10.1016/j.chest.2020.03.012