
Insights · Generating insight
Translating Qualitative Insights into Quantifiable Knowledge Assets
How to turn findings from interviews, observation and other qualitative research into measures, estimates and reusable knowledge assets, covering mixed methods designs, scale development, choice-based methods, quantitising, and the codification of insight for later use.
Qualitative research is often where insight begins. An interview reveals a frustration no survey had asked about; observation shows a workaround that suggests an unmet need; a focus group surfaces language and motives that explain a puzzling result. But qualitative findings come from small numbers of people and are usually expressed in words rather than numbers. Decision makers then ask questions that qualitative research alone cannot answer. How many customers feel this way? Which segment is most affected? How much does it matter compared with other issues? Will it change what people buy?
Answering these questions means translating qualitative insight into quantified knowledge: measures that can be applied at scale, estimates of size and importance, and records that others in the organisation can find and reuse. This article describes how that translation works, the methods involved, and the care needed to keep what made the qualitative finding valuable.
Why translation is needed, and what it risks
Qualitative and quantitative research answer different kinds of questions. Qualitative research is good at discovering what matters, how people think about it and why they behave as they do. Its samples are usually chosen to capture variety rather than to represent a population in proportion. Small (2009) explained that qualitative case selection follows a different logic from statistical sampling: cases are chosen to reveal processes and mechanisms, not to estimate how common they are. Quantitative research is good at measuring how common something is, how strongly it relates to other things and how it differs between groups.
Translation therefore adds something the qualitative finding lacks: an estimate of prevalence, strength or effect. It also risks losing something: the context, nuance and explanation that made the finding insightful. A rich account of why a customer distrusts automated advice can become a single survey item, "I trust automated financial advice", that strips away the reasons. Good translation keeps both: it quantifies what can be quantified while preserving the explanation that gives the numbers meaning.
Mixed methods designs
Research on mixed methods provides a framework for combining qualitative and quantitative work. Johnson et al. (2007) described mixed methods research as combining qualitative and quantitative approaches for breadth and depth of understanding and for corroboration. Greene et al. (1989) identified several purposes for such combinations, including development, in which the results of one method are used to inform another.
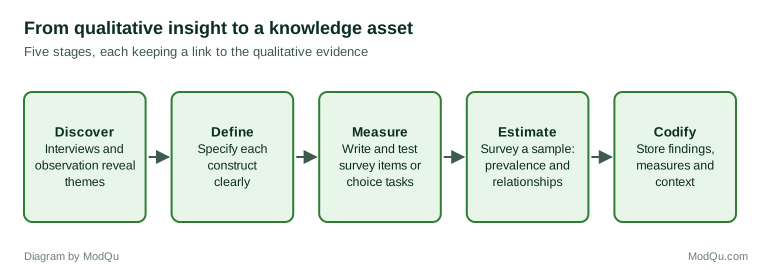
Creswell and Plano Clark (2018) described the exploratory sequential design, in which qualitative research comes first and its results are used to build a quantitative instrument or study. This is the design most directly concerned with translating qualitative insight into quantified knowledge. Morgan (1998) described practical strategies for sequencing qualitative and quantitative methods, emphasising that one method usually plays the principal role and the other a complementary one, and that this choice should follow the research question.
Integration is the key. Bryman (2006) found that many studies described as mixed methods presented qualitative and quantitative results side by side without truly combining them. Fetters et al. (2013) described how integration can be achieved at the level of design, methods and interpretation. In translation work, integration at the methods level is central: the qualitative findings directly determine what the quantitative study measures.
Is the qualitative evidence ready?
Before translating, it is worth asking whether the qualitative work has gone far enough. A theme raised by two of eight interviewees may be an early signal or an accident of who happened to be interviewed. Guest et al. (2006) examined how many interviews were needed before new interviews stopped producing new themes in one study, and found that most themes had appeared within the first twelve interviews, with the main themes present after about six. The number needed depends on how varied the population is and how focused the questions are, but the practical point is that translation should start from themes that have recurred across different kinds of participants, not from a single memorable conversation.
It also helps to separate what the qualitative work found from what it suggested. Some findings are well supported: many participants described the same problem in similar terms. Others are hypotheses: a plausible explanation that one or two participants offered. Both can be translated, but they lead to different quantitative questions. A well-supported finding needs a measure of its size; a hypothesis needs a test of whether it holds at all.
From themes to constructs
The first step is to turn qualitative themes into clearly defined constructs: concepts that can be measured. A theme such as "customers feel the app doesn't understand them" might contain several distinct constructs: perceived relevance of recommendations, perceived effort to find things, and a sense of being treated as a number. Defining each one separately makes measurement possible and keeps the analysis precise.
Rossiter (2002) argued that the most important stage of measure development in marketing is defining the construct precisely: the object being rated, the attribute being measured and the person doing the rating. Clark and Watson (1995) similarly emphasised that a clear conceptual definition, grounded in an understanding of the phenomenon, is the foundation of a valid measure. Qualitative research is the natural source of this understanding. It shows what the construct means to customers and how they express it.
Developing measures
Once constructs are defined, they must be turned into measures. Churchill (1979) set out a widely used paradigm for developing measures of marketing constructs: specify the domain of the construct, generate a sample of items, collect data, purify the measure by removing poor items, collect new data, and assess reliability and validity. DeVellis (2017) described the same process in more detail, including how to write clear items, choose response formats and test the structure of a scale.
Qualitative research contributes most to item generation. Interviews and open-ended responses provide the language customers use, which helps items sound natural and mean the same thing to respondents as to researchers. Griffin and Hauser (1993) showed that a moderate number of interviews could identify most of the needs customers have in a product category, and these statements of need can be turned directly into survey items.
Items should then be tested. Willis (2005) described cognitive interviewing, in which respondents think aloud as they answer draft questions or respond to follow-up probes about what a question meant to them and how they arrived at their answer. Such interviews often reveal that a phrase taken from one customer means something different to another, that a question asks about two things at once, or that the response options do not fit how people think about the issue. Pilot surveys then show whether items discriminate between respondents, whether they group together as expected, and whether any are skipped or answered in the same way by almost everyone. Measures that pass these tests can be used at scale with greater confidence.
Testing is also where the qualitative and quantitative sides of the work meet most directly. A cognitive interview is itself a small piece of qualitative research, and what it finds often sharpens the construct definition as well as the wording. A team that discovers respondents read "relevant offers" as "offers I can afford" has learned something about the construct, not only about the item.
Estimating prevalence and importance
With measures in place, a quantitative study can estimate how common a qualitative finding is, which groups it affects most and how strongly it relates to outcomes such as satisfaction or purchase.
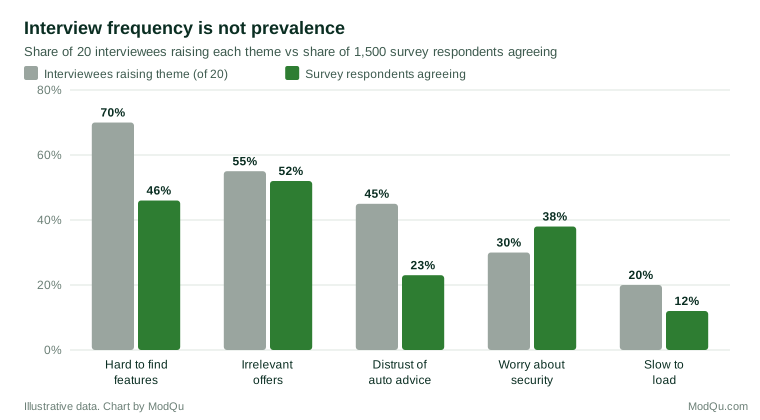
The example illustrates an important point. The frequency with which a theme appears in interviews is not a measure of its prevalence. Interview samples are small and purposive, and themes that people find easy to talk about may come up more often than those they find sensitive. In the example, worry about security was raised by relatively few interviewees but is widely shared in the survey, perhaps because people are reluctant to discuss it, while distrust of automated advice was a strong interview theme that turns out to be held by a minority.
Importance can be estimated in several ways. Relating each measure to an outcome, such as overall satisfaction or intention to stay, shows which issues are most strongly associated with the outcome. Choice-based methods go further by asking people to make trade-offs. Conjoint analysis, reviewed by Green and Srinivasan (1990), presents respondents with products described by combinations of attributes and infers the value of each attribute from their choices. Louviere and Woodworth (1983) developed the design and analysis of choice experiments, which present sets of alternatives and ask respondents to choose. Best-worst scaling, introduced by Finn and Louviere (1992), asks respondents to choose the most and least important items from small sets, which produces clearer distinctions in importance than rating scales, where respondents often rate everything as important. These methods are particularly useful for turning qualitative lists of needs or concerns into a ranked order of priorities. The qualitative work remains essential here, because a choice experiment can only rank the attributes it includes. If the interviews missed an important concern, the quantitative ranking will miss it too, and will do so with a misleading appearance of completeness.
Quantitising qualitative data directly
Sometimes qualitative data can be quantified directly, without a separate survey. Sandelowski et al. (2009) described "quantitising", the conversion of qualitative data into numbers, for example by counting how many participants mentioned a theme or by rating the intensity of each participant's view. Content analysis, as described by Krippendorff (2018), provides methods for coding text systematically and checking the reliability of coding, for example by measuring agreement between coders with Cohen's (1960) kappa.
Quantitised qualitative data must be interpreted carefully. Sandelowski et al. (2009) warned that counts from small, purposive samples should not be treated as estimates of population prevalence, and that the act of counting can obscure the meaning of what is counted. Quantitising is most useful for describing patterns within a qualitative study and for linking qualitative and quantitative data on the same participants, not for replacing a representative survey.
Preserving meaning
The main risk in translation is that numbers become detached from the understanding that gave rise to them. Several practices help keep them connected.
Keep the link to the qualitative evidence. Each measure should be documented with the qualitative themes it came from, the definition of the construct and examples of what customers said.
Report numbers with explanations. A finding that 38% of customers worry about security is more useful when accompanied by an explanation, drawn from the qualitative work, of what they worry about and why.
Return to qualitative research when numbers surprise. If a quantitative result does not fit expectations, follow-up interviews can explain it. Creswell and Plano Clark (2018) described this as an explanatory sequential design, the reverse of the exploratory design used for translation.
Judge credibility on both sides. Lincoln and Guba (1985) proposed criteria for judging the trustworthiness of qualitative research, including credibility and transferability. Quantitative measures should meet standards of reliability and validity. Translation that satisfies both sets of standards produces knowledge that is both meaningful and measurable.
Turning insight into knowledge assets
The final step is to make the translated insight reusable. A knowledge asset is a piece of knowledge stored in a form that others can find, understand and apply: a validated measure, a segmentation, a ranked list of customer needs, a model of what drives satisfaction, or a short summary of a key finding with its evidence.
Research on knowledge management explains why this matters and how to do it well. Nonaka (1994) described organisational knowledge creation as a continuing conversion between tacit knowledge, held by individuals and hard to express, and explicit knowledge, which can be recorded and shared. Translating qualitative insight into defined constructs, measures and documented findings is a form of this conversion: it makes knowledge that existed in the heads of researchers and the words of participants explicit and shareable. Hansen et al. (1999) distinguished strategies that codify knowledge in documents and databases from those that rely on connecting people, and argued that organisations need both. Alavi and Leidner (2001) argued that knowledge management systems are effective only when they support the creation, storage, transfer and application of knowledge, not storage alone.
Markus (2001) found that knowledge is reused successfully when it is documented with enough context for people who were not involved in creating it. For translated insight, this means recording not only the numbers but also the qualitative origin, the construct definition, the measure used, the sample and date, the main limitations, and a contact who can explain the work.
Validated measures are particularly valuable assets. Once a construct has been defined and a measure tested, the measure can be reused in later studies, allowing results to be compared over time and across markets. A measure of "perceived effort", developed from interviews and validated in a survey, can become a standard element of the organisation's tracking research, connecting future results back to the original insight.
Knowledge assets also need maintenance. Customer language changes, products change, and a measure developed five years ago may no longer capture what customers mean by "effort" or "relevance". A simple discipline is to assign each important asset an owner and a review date, and to run a small round of qualitative work when the review falls due, checking whether the constructs still reflect how customers talk and think. In this way the translation from qualitative to quantitative becomes a cycle rather than a single project: qualitative research creates and refreshes the measures, quantitative research applies them at scale, and surprising results send the team back to qualitative research for explanation.
A worked example
Consider a hypothetical bank that wants to understand why customers use its mobile app less than expected. Twenty interviews with customers reveal several themes: features are hard to find, offers feel irrelevant, some customers distrust automated advice, some worry about security, and a few find the app slow. The interviews also reveal the language customers use, such as "I can never find where they've moved things" and "it keeps offering me loans I don't want".
The insight team defines a construct for each theme and writes survey items using customers' language, then tests the items in cognitive interviews and a small pilot. Two items are reworded because respondents interpret them differently from what was intended. A survey of 1,500 app users then measures the prevalence of each issue and its relationship to how often customers use the app. A best-worst exercise asks customers which improvements would matter most to them.
The results change the priorities suggested by the interviews. Irrelevant offers and difficulty finding features are the most widespread issues and the most strongly associated with low use. Security worries are more common than the interviews suggested and are concentrated among older customers. Distrust of automated advice, a striking interview theme, is held by a minority and is only weakly associated with use.
The team stores the results as knowledge assets: a validated set of measures for app experience, a ranked list of improvement priorities with their evidence, and a short summary linking each number to the interview findings and quotes. These assets are used in the next year's tracking study and in the product team's planning, and the measures are reused to test whether changes to the app improve the experience.
Common mistakes
Several mistakes recur. Treating the frequency of themes in interviews as an estimate of prevalence leads to wrong priorities. Writing survey items without testing them produces measures that respondents interpret differently from researchers. Translating rich themes into single, vague items loses the meaning that made them valuable. Reporting numbers without explanation leaves decision makers with figures they cannot interpret. And failing to store measures and findings with their context means that the same translation must be done again for the next project.
Key takeaways
Translating qualitative insight into quantified knowledge allows organisations to estimate how common and how important a finding is and to compare it across groups and over time. The exploratory sequential design, in which qualitative research informs a quantitative study, provides the framework. The steps are to define clear constructs from qualitative themes, develop and test measures using customers' own language, estimate prevalence and importance with representative surveys and choice-based methods, and preserve the link between numbers and their qualitative explanation. Storing the results as documented, reusable knowledge assets, especially validated measures, allows the insight to inform decisions long after the original study.
References
Alavi, M., & Leidner, D. E. (2001). Review: Knowledge management and knowledge management systems: Conceptual foundations and research issues. MIS Quarterly, 25(1), 107–136. https://doi.org/10.2307/3250961
Bryman, A. (2006). Integrating quantitative and qualitative research: How is it done? Qualitative Research, 6(1), 97–113. https://doi.org/10.1177/1468794106058877
Churchill, G. A., Jr. (1979). A paradigm for developing better measures of marketing constructs. Journal of Marketing Research, 16(1), 64–73. https://doi.org/10.1177/002224377901600110
Clark, L. A., & Watson, D. (1995). Constructing validity: Basic issues in objective scale development. Psychological Assessment, 7(3), 309–319. https://doi.org/10.1037/1040-3590.7.3.309
Cohen, J. (1960). A coefficient of agreement for nominal scales. Educational and Psychological Measurement, 20(1), 37–46. https://doi.org/10.1177/001316446002000104
Creswell, J. W., & Plano Clark, V. L. (2018). Designing and conducting mixed methods research (3rd ed.). SAGE.
DeVellis, R. F. (2017). Scale development: Theory and applications (4th ed.). SAGE.
Fetters, M. D., Curry, L. A., & Creswell, J. W. (2013). Achieving integration in mixed methods designs: Principles and practices. Health Services Research, 48(6, Pt. 2), 2134–2156. https://doi.org/10.1111/1475-6773.12117
Finn, A., & Louviere, J. J. (1992). Determining the appropriate response to evidence of public concern: The case of food safety. Journal of Public Policy & Marketing, 11(2), 12–25. https://doi.org/10.1177/074391569201100202
Green, P. E., & Srinivasan, V. (1990). Conjoint analysis in marketing: New developments with implications for research and practice. Journal of Marketing, 54(4), 3–19. https://doi.org/10.1177/002224299005400402
Greene, J. C., Caracelli, V. J., & Graham, W. F. (1989). Toward a conceptual framework for mixed-method evaluation designs. Educational Evaluation and Policy Analysis, 11(3), 255–274. https://doi.org/10.3102/01623737011003255
Griffin, A., & Hauser, J. R. (1993). The voice of the customer. Marketing Science, 12(1), 1–27. https://doi.org/10.1287/mksc.12.1.1
Guest, G., Bunce, A., & Johnson, L. (2006). How many interviews are enough? An experiment with data saturation and variability. Field Methods, 18(1), 59–82. https://doi.org/10.1177/1525822X05279903
Hansen, M. T., Nohria, N., & Tierney, T. (1999). What's your strategy for managing knowledge? Harvard Business Review, 77(2), 106–116.
Johnson, R. B., Onwuegbuzie, A. J., & Turner, L. A. (2007). Toward a definition of mixed methods research. Journal of Mixed Methods Research, 1(2), 112–133. https://doi.org/10.1177/1558689806298224
Krippendorff, K. (2018). Content analysis: An introduction to its methodology (4th ed.). SAGE.
Lincoln, Y. S., & Guba, E. G. (1985). Naturalistic inquiry. SAGE.
Louviere, J. J., & Woodworth, G. (1983). Design and analysis of simulated consumer choice or allocation experiments: An approach based on aggregate data. Journal of Marketing Research, 20(4), 350–367. https://doi.org/10.1177/002224378302000403
Markus, M. L. (2001). Toward a theory of knowledge reuse: Types of knowledge reuse situations and factors in reuse success. Journal of Management Information Systems, 18(1), 57–93. https://doi.org/10.1080/07421222.2001.11045671
Morgan, D. L. (1998). Practical strategies for combining qualitative and quantitative methods: Applications to health research. Qualitative Health Research, 8(3), 362–376. https://doi.org/10.1177/104973239800800307
Nonaka, I. (1994). A dynamic theory of organizational knowledge creation. Organization Science, 5(1), 14–37. https://doi.org/10.1287/orsc.5.1.14
Rossiter, J. R. (2002). The C-OAR-SE procedure for scale development in marketing. International Journal of Research in Marketing, 19(4), 305–335. https://doi.org/10.1016/S0167-8116(02)00097-6
Sandelowski, M., Voils, C. I., & Knafl, G. (2009). On quantitizing. Journal of Mixed Methods Research, 3(3), 208–222. https://doi.org/10.1177/1558689809334210
Small, M. L. (2009). "How many cases do I need?" On science and the logic of case selection in field-based research. Ethnography, 10(1), 5–38. https://doi.org/10.1177/1466138108099586
Willis, G. B. (2005). Cognitive interviewing: A tool for improving questionnaire design. SAGE.