
Insights · Generating insight
Open-Ended Responses as a Rich Source of Insight
Why open-ended survey questions reveal what closed questions miss, how to design them, how to code and analyse the answers reliably, and how automated text methods and language models can help at scale.
Closed survey questions ask respondents to choose from answers the researcher has already written. They are efficient, easy to analyse and comparable over time. But they can only find what the researcher thought to ask about. Open-ended questions, which let respondents answer in their own words, can reveal reasons, problems and ideas that no one anticipated. They are often the richest source of insight in a survey, and also the most neglected, because analysing them takes effort.
What open questions reveal
Schuman and Presser (1979) compared open and closed versions of the same questions in national surveys. The closed versions strongly shaped the answers: respondents tended to choose from the options offered and rarely volunteered alternatives, even when invited to do so. The open versions produced a wider spread of answers, including some that the closed lists had omitted. The choice of format therefore affects not only the detail of answers but also the conclusions a survey reaches.
Open responses also show what is most salient to respondents. Geer (1991) examined whether open-ended questions capture the issues that matter most to people, and found that respondents generally mentioned the considerations that were most important to them, supporting the use of open questions to identify salient concerns. In customer research, an open question such as "What is the main reason for your score?" shows which aspects of an experience come to mind first, in customers' own language.
Designing open questions
The quality of open responses depends on design. Krosnick (1991) described how respondents often satisfice, giving answers that are good enough rather than fully considered, especially when questions are demanding and motivation is low. Open questions are demanding, so they suffer particularly from satisficing in the form of short, vague or skipped answers.
Several practices help. Ask open questions early enough that respondents are still engaged; Galesic and Bosnjak (2009) found that answers to open questions became shorter the later they appeared in a long web questionnaire. Make the question specific: "What one thing would most improve your experience?" produces more useful answers than "Any comments?". Smyth et al. (2009) found that the size of the answer box and brief instructions encouraging respondents to explain their answers influenced the length and detail of responses in web surveys. And limit the number of open questions, so that respondents give full attention to each.
Coding open responses
To be analysed systematically, open responses are usually coded: each answer is assigned to one or more categories, or themes, that describe its content.
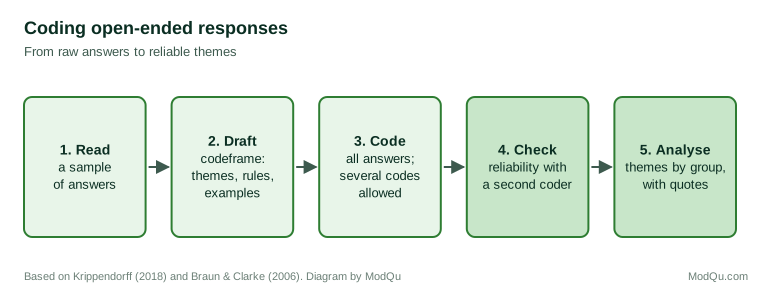
Krippendorff (2018) described content analysis as a systematic, replicable method for making inferences from text, and emphasised clear coding rules and tests of reliability. Hsieh and Shannon (2005) distinguished three approaches: conventional content analysis, in which categories emerge from the data; directed content analysis, in which an existing framework guides coding; and summative content analysis, which counts and compares the use of particular words or content. Braun and Clarke (2006) described thematic analysis, a flexible method for identifying, analysing and reporting patterns of meaning in qualitative data, which is often used for richer open responses.
In practice, analysts usually begin by reading a sample of responses and drafting a codeframe, a list of themes with definitions and examples. All responses are then coded, the codeframe is refined as new themes appear, and multiple codes are allowed when an answer mentions several things.
Reliability matters because coding involves judgement. A common check is to have a second coder code a sample of responses independently and to measure agreement. Cohen's (1960) kappa measures agreement beyond what would be expected by chance. Landis and Koch (1977) proposed widely used benchmarks for interpreting it, describing values above 0.6 as substantial agreement and values above 0.8 as almost perfect. Low agreement usually indicates that theme definitions are unclear and need revision.
Analysing coded responses
Once coded, open responses can be analysed like closed questions: the frequency of each theme can be compared across customer groups, over time, or against other measures such as satisfaction or likelihood to leave.
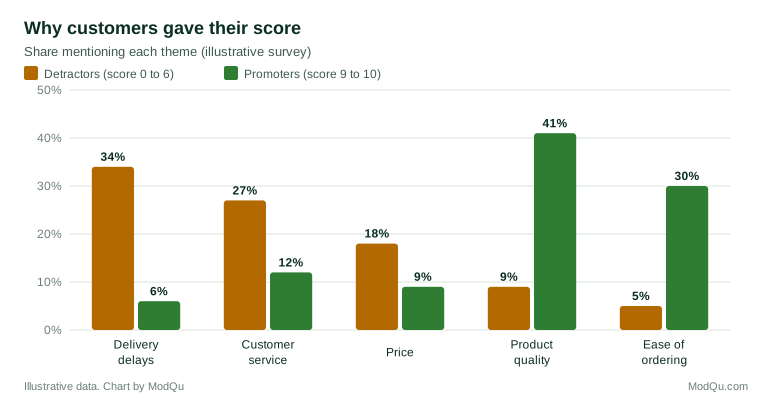
The example shows a common pattern. The reasons customers give for low scores are often different from the reasons for high scores, so improving the things that delight promoters may do little for detractors. Comparing themes across groups reveals these differences in a way that closed questions, limited to pre-defined attributes, may not.
Frequencies are only part of the value. A small number of responses may describe a serious or novel problem that deserves attention despite its rarity. Representative quotes make themes concrete for decision makers and show the language customers use. Linking themes to other answers in the same survey adds further depth: for example, comparing the scores of respondents who mention a theme with those who do not shows how strongly each theme is associated with overall satisfaction.
Common problems
Several problems recur in the analysis of open responses. Codeframes that are too broad, such as a single "service" theme, hide important differences; codeframes that are too detailed produce many small themes that are hard to interpret. A useful rule is to keep themes specific enough to suggest an action, and to group them into a smaller number of higher-level categories for reporting.
Non-response and very short answers are another problem. Respondents who skip open questions or answer in one or two words may differ from those who write at length, so theme frequencies describe those who answered, not necessarily all respondents. Reporting the share who gave a codable answer helps readers judge this.
Finally, analysts sometimes treat open responses only as a source of quotes, chosen to illustrate a conclusion already reached. This wastes their value and risks confirmation bias. Systematic coding, applied to all responses, protects against selecting only the quotes that fit.
An example
Consider a hypothetical online retailer whose net promoter score has fallen for two quarters. The closed questions in its survey show small declines in satisfaction with delivery and service, but nothing dramatic. Coding the open responses to "What is the main reason for your score?" tells a clearer story. Among detractors, mentions of delivery delays have nearly doubled, and many of these responses mention a specific courier introduced in one region. Mentions of customer service often refer to difficulty reaching anyone about a late delivery. The two themes are connected: the service problem is largely a consequence of the delivery problem.
The closed questions had shown that something was wrong; the open responses showed what, where and why. The retailer can now act on a specific cause, and track the relevant themes in later surveys to see whether the change works.
Automated analysis at scale
Large surveys and continuous feedback programmes can produce tens of thousands of open responses, too many to code by hand. Automated text analysis can help. Grimmer and Stewart (2013) reviewed automated content analysis methods and stressed that they amplify rather than replace human reading: their output must be validated against human judgement for each new application. Topic models, such as latent Dirichlet allocation (Blei et al., 2003), identify groups of words that tend to appear together, which can suggest themes. Roberts et al. (2014) developed structural topic models designed for open-ended survey responses, which allow the prevalence of topics to be related to respondent characteristics. Berger et al. (2020) reviewed how text analysis is being used for marketing insight and described both its potential and the care needed in interpreting results.
Large language models have added new possibilities. Gilardi et al. (2023) found that a general-purpose language model performed well against crowd workers on several text classification tasks, at much lower cost. Such tools can draft codeframes, code responses against a defined codeframe and summarise themes. But their output should be checked in the same way as a human coder's: by comparing a sample with careful human coding, measuring agreement, and reviewing cases where the model is uncertain or wrong.
Key takeaways
Open-ended questions reveal reasons, problems and language that closed questions miss, and the choice between open and closed formats can change a survey's conclusions. Good design, specific questions placed early with encouragement to explain, improves response quality. Systematic coding with a clear codeframe and a reliability check turns responses into evidence that can be compared across groups and over time. Automated methods and language models make large volumes manageable, but their output must be validated against human coding.
References
Berger, J., Humphreys, A., Ludwig, S., Moe, W. W., Netzer, O., & Schweidel, D. A. (2020). Uniting the tribes: Using text for marketing insight. Journal of Marketing, 84(1), 1–25. https://doi.org/10.1177/0022242919873106
Blei, D. M., Ng, A. Y., & Jordan, M. I. (2003). Latent Dirichlet allocation. Journal of Machine Learning Research, 3, 993–1022.
Braun, V., & Clarke, V. (2006). Using thematic analysis in psychology. Qualitative Research in Psychology, 3(2), 77–101. https://doi.org/10.1191/1478088706qp063oa
Cohen, J. (1960). A coefficient of agreement for nominal scales. Educational and Psychological Measurement, 20(1), 37–46. https://doi.org/10.1177/001316446002000104
Galesic, M., & Bosnjak, M. (2009). Effects of questionnaire length on participation and indicators of response quality in a web survey. Public Opinion Quarterly, 73(2), 349–360. https://doi.org/10.1093/poq/nfp031
Geer, J. G. (1991). Do open-ended questions measure "salient" issues? Public Opinion Quarterly, 55(3), 360–370. https://doi.org/10.1086/269268
Gilardi, F., Alizadeh, M., & Kubli, M. (2023). ChatGPT outperforms crowd workers for text-annotation tasks. Proceedings of the National Academy of Sciences, 120(30), Article e2305016120. https://doi.org/10.1073/pnas.2305016120
Grimmer, J., & Stewart, B. M. (2013). Text as data: The promise and pitfalls of automatic content analysis methods for political texts. Political Analysis, 21(3), 267–297. https://doi.org/10.1093/pan/mps028
Hsieh, H.-F., & Shannon, S. E. (2005). Three approaches to qualitative content analysis. Qualitative Health Research, 15(9), 1277–1288. https://doi.org/10.1177/1049732305276687
Krippendorff, K. (2018). Content analysis: An introduction to its methodology (4th ed.). SAGE.
Krosnick, J. A. (1991). Response strategies for coping with the cognitive demands of attitude measures in surveys. Applied Cognitive Psychology, 5(3), 213–236. https://doi.org/10.1002/acp.2350050305
Landis, J. R., & Koch, G. G. (1977). The measurement of observer agreement for categorical data. Biometrics, 33(1), 159–174. https://doi.org/10.2307/2529310
Roberts, M. E., Stewart, B. M., Tingley, D., Lucas, C., Leder-Luis, J., Gadarian, S. K., Albertson, B., & Rand, D. G. (2014). Structural topic models for open-ended survey responses. American Journal of Political Science, 58(4), 1064–1082. https://doi.org/10.1111/ajps.12103
Schuman, H., & Presser, S. (1979). The open and closed question. American Sociological Review, 44(5), 692–712. https://doi.org/10.2307/2094521
Smyth, J. D., Dillman, D. A., Christian, L. M., & McBride, M. (2009). Open-ended questions in web surveys: Can increasing the size of answer boxes and providing extra verbal instructions improve response quality? Public Opinion Quarterly, 73(2), 325–337. https://doi.org/10.1093/poq/nfp029