
Insights · Generating insight
Trend Insight: Separating Lasting Shifts From Fads
How to tell lasting shifts in consumer behaviour from short-lived fads, drawing on research on diffusion, fashion, social influence and forecasting, with practical tests for judging whether a trend is real, how big it is and how long it will last.
Few questions matter more to organisations than which changes in consumer behaviour will last. A real shift, such as the move to online shopping or the growing interest in sustainability, can reshape markets for decades. A fad, such as a novelty product or a short-lived style, can generate excitement and then vanish, leaving those who invested heavily with unsold stock and abandoned plans. Trend insight is the work of telling them apart early enough to act.
This is difficult, and confident predictions are often wrong. But research on how innovations spread, how fashions rise and fall, how social influence shapes popularity and how forecasts succeed or fail offers useful guidance. This article draws on that research to describe what distinguishes lasting shifts from fads, the data and methods used to detect them, and a set of practical tests for judging a trend.
What is a trend?
The word "trend" is used loosely. It helps to distinguish several things.
A statistical trend is a sustained movement in a measured quantity, such as rising sales of a product category, after allowing for seasonal patterns and random variation. Cleveland et al. (1990) described a widely used method for decomposing a time series into trend, seasonal and remainder components, which helps separate a genuine change in direction from a seasonal peak or a one-off spike.
A consumer trend is a change in what people want, value or do, which may show up in many statistical series at once. A growing preference for convenience, for example, appears in food, retail, banking and media.
A fad is a rapid rise in popularity followed by a rapid decline, often within months or a few years, with little lasting change in underlying behaviour.
A fashion is a recurring change in taste, in which styles rise and fall in cycles, often driven by people's desire to distinguish themselves from others.
The aim of trend insight is to identify consumer trends and statistical trends that reflect lasting shifts, and to recognise fads and fashions for what they are.
How lasting shifts spread
Research on the diffusion of innovations describes how new products and practices spread through a population. Rogers (2003) synthesised several decades of studies and found that adoption usually follows an S-shaped curve over time: slow at first, accelerating as more people adopt, and slowing as the market approaches saturation. Rogers described adopters as falling into groups, from innovators and early adopters to the early majority, late majority and laggards, and identified characteristics of innovations that speed their adoption: relative advantage over existing options, compatibility with existing values and practices, low complexity, the ability to try the innovation before committing, and visibility of its results to others.
Bass (1969) developed a mathematical model of diffusion in which adoption is driven by two forces: innovation, the tendency of some people to adopt independently, and imitation, the tendency of others to adopt because people they know have done so. The model has been used widely to forecast the growth of new product categories. Moore (1991) argued that, for technology products in particular, there is often a gap between early adopters, who are attracted by novelty, and the early majority, who want proven, practical solutions; many products that appear to be trends fail to cross this gap.
Rogers' characteristics provide a first test for distinguishing lasting shifts from fads. A change that offers a genuine advantage, fits with people's values and routines, and solves a recurring problem is more likely to last than one whose appeal rests mainly on novelty.
How fads and fashions behave
Research on fads and fashions shows that popularity can rise and fall for reasons unconnected with real advantage. Abrahamson (1991) argued that management practices spread not only because they are efficient but also through fads and fashions, as organisations imitate each other or follow influential advisers. Abrahamson (1996) described how management fashions follow bell-shaped curves of attention, rising rapidly and then declining as new fashions replace them. Consumer fads behave similarly.
Several findings help explain the dynamics. Berger and Le Mens (2009) studied first names given to babies in the United States and France and found that names that rose in popularity quickly also declined more quickly, and suggested that rapid adoption makes a taste seem faddish, leading people to abandon it. Lieberson (2000) studied changes in first names and other tastes and argued that much of the change arises from internal mechanisms of taste, such as people's desire for names that are neither too common nor too unusual, rather than from external events. This suggests that some changes in popularity follow their own cycles and should not be interpreted as signals of deeper shifts.
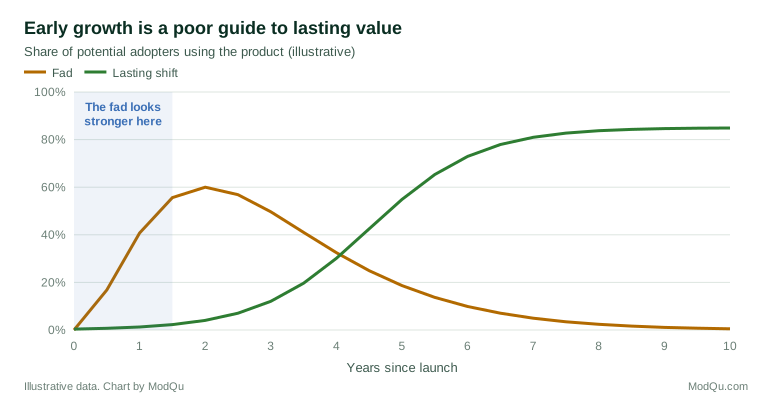
The chart illustrates the central difficulty. In the first year or two, a fad and a lasting shift can look very similar, and the fad may even look stronger, because it is growing faster. The shapes become distinct only later, when it may be too late to act.
Why popularity is hard to predict
Popularity is shaped by social influence, which makes it inherently unpredictable. Salganik et al. (2006) created an online music market in which participants could listen to and download songs. In some versions of the market, participants could see how many times each song had been downloaded by others; in others, they could not. Social influence made success more unequal, with popular songs becoming much more popular, and also more unpredictable: the same song could become a hit in one version of the market and fail in another. Quality mattered, since the best songs rarely did very badly and the worst rarely did very well, but it did not determine outcomes.
Social media can intensify these dynamics. When popularity is visible in real time, through counts of views, likes and shares, the feedback loop that Salganik et al. (2006) created experimentally operates continuously and at very large scale. Content and products can become widely known within days, and fall from attention just as fast, without any change in the underlying needs or values of the people involved.
The implication for trend insight is that early popularity is not strong evidence of lasting value. A product or idea may gain attention through chance and social amplification, and lose it just as quickly.
The track record of forecasting
Trend forecasting has a mixed record. Tetlock (2005) studied thousands of predictions by experts in politics and economics over many years and found that their accuracy was, on average, only slightly better than chance, and that experts with grand, confident theories did worse than those who drew on many sources and adjusted their views as new evidence arrived. Tetlock and Gardner (2015) described later research in which some forecasters achieved consistently better results by breaking questions into parts, starting from base rates, updating frequently in small steps, and keeping score of their accuracy.
Popular frameworks for technology trends also need to be treated with care. The hype cycle, popularised by the research firm Gartner and described by Fenn and Raskino (2008), proposes that new technologies pass through a peak of inflated expectations, a trough of disillusionment and a later plateau of productive use. Dedehayir and Steinert (2016) reviewed research on the hype cycle and found that empirical support for it as a general pattern was limited, with many technologies following different paths. The framework is a useful reminder that early enthusiasm often overshoots, but not a reliable predictive model.
Sources of evidence
Trend insight draws on several kinds of evidence.
Sales and behavioural data show what people actually do. Long time series, analysed with methods that separate trend from seasonality and noise, provide the most direct evidence of sustained change (Cleveland et al., 1990; Hyndman & Athanasopoulos, 2021).
Search and social data can detect changes in interest quickly. Choi and Varian (2012) showed that search query data could improve short-term estimates of economic indicators such as car sales and travel. But such data can also mislead: Ginsberg et al. (2009) showed that search data could track influenza activity, yet the same approach later overestimated it substantially, in part because search behaviour and the search engine itself changed (Lazer et al., 2014). Online attention is a signal of interest, not of lasting behaviour.
Surveys of values and attitudes track slower, deeper changes. Inglehart (1997) used repeated surveys across many countries to document long-term shifts in values that accompanied economic development, such as a growing emphasis on self-expression and quality of life. Changes in values tend to be gradual and durable, and they often underlie consumer trends that appear in many categories at once.
Weak signals are early, fragmentary indications of change at the edges of a market. Ansoff (1975) argued that organisations should respond to weak signals with graduated actions, from monitoring to flexible preparation, rather than waiting for strong evidence. Day and Schoemaker (2006) described how organisations can develop "peripheral vision" by scanning the edges of their markets, including unusual customers, new entrants and adjacent industries.
Tests for judging a trend
Drawing on the research above, several tests help judge whether an observed change is likely to be a lasting shift.
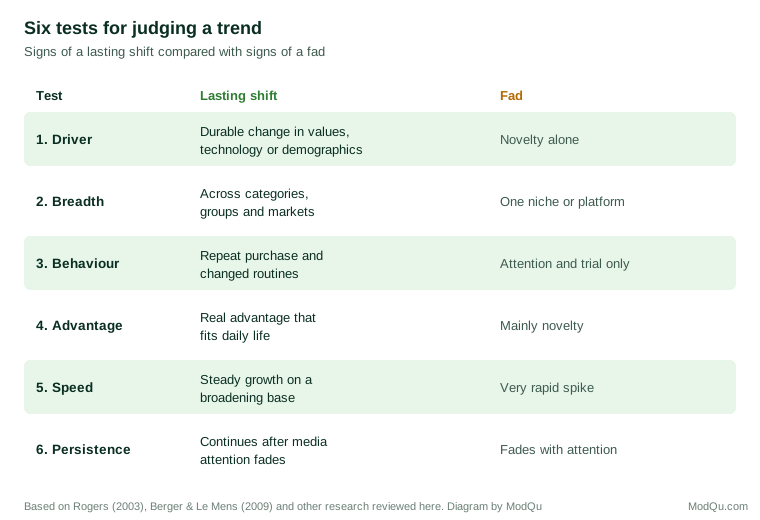
1. Is there a durable underlying driver? Lasting consumer trends are usually connected to changes in values, technology, demographics, economics or regulation that are themselves slow to reverse. A trend with no such driver, whose appeal rests on novelty or social display, is more likely to be a fad.
2. Does it appear in more than one place? A real shift tends to show up across categories, demographic groups and markets. Interest in convenience, for example, appears in many categories at once. A change confined to one product, one social media platform or one small group may be a fad or a niche.
3. Does it show up in behaviour, not only attention? Repeat purchase, sustained use and changes in routines are stronger evidence than searches, posts and media coverage. Trial is easy; adoption into daily life is harder and more telling.
4. Does it offer real advantage and fit people's lives? Rogers' (2003) characteristics of successful innovations, relative advantage, compatibility, simplicity, trialability and observability, are a useful checklist.
5. How fast is it growing? Very rapid growth is not necessarily a good sign. Berger and Le Mens' (2009) findings suggest that things that rise fastest can also fall fastest. Steady growth across a broadening base is often a better indicator of durability than a sharp spike.
6. Does it persist when attention fades? If interest falls as soon as media coverage moves on, the change was probably driven by attention rather than by real demand.
Making decisions under uncertainty
Because trends cannot be predicted with certainty, the way an organisation responds matters as much as its forecast. Scenario planning offers one approach. Wack (1985) described how Shell used scenarios, alternative plausible stories about the future, to prepare its managers for changes that conventional forecasts did not anticipate, including the oil price shock of the early 1970s. Schoemaker (1995) described scenario planning as a tool for thinking about uncertainty by constructing several distinct futures and testing strategies against each, rather than betting on a single prediction.
For trend insight, this suggests matching the size of the response to the strength of the evidence. In practice, this often means asking not "will this trend last?" but "what would we need to see to be confident that it will, and how can we keep our options open until we see it?" Weak signals justify monitoring and small experiments. Stronger evidence, such as behaviour change across several groups and categories with a durable driver, justifies larger commitments. Options that can be scaled up or down as the evidence develops, such as limited product launches or partnerships, are often wiser than large, irreversible investments based on early enthusiasm.
A worked example
Consider a hypothetical drinks company deciding how to respond to rising interest in low- and no-alcohol drinks. Applying the tests in turn gives a structured view.
The underlying drivers appear durable: long-term survey evidence of growing interest in health and wellbeing, changes in social habits among younger adults, and regulatory pressure on alcohol in several markets. The change appears in several places: in beer, wine and spirits, in several countries and across age groups, although most strongly among younger adults. Behavioural evidence is mixed but positive: sales data show repeat purchase among a growing group of buyers, not only one-off trial. The products offer a real advantage for occasions such as driving, working lunches and exercise, and fit easily into existing routines. Growth has been steady rather than explosive. And interest has persisted through several cycles of media attention.
On this evidence, the change looks more like a lasting shift than a fad. The company might therefore make moderate, scalable commitments, such as extending successful products into new markets and building capability in product development, while continuing to monitor repeat purchase and the composition of buyers. If evidence weakened, for example if repeat purchase stalled, the commitments could be slowed. The same tests applied to a novelty flavour that spikes on social media, appears in one product and one platform, and shows little repeat purchase would point the other way.
Building a trend monitoring process
Trend insight works best as a continuing process rather than an occasional report. A practical process scans a defined set of sources regularly, records potential trends in a shared log with the evidence for each, applies the tests consistently, and reviews the log at fixed intervals to promote, downgrade or retire entries as evidence changes. Assigning owners to the most important trends, with clear indicators to watch, helps ensure that early signals reach decision makers.
There is evidence that such capabilities pay. Rohrbeck and Kum (2018) studied firms over several years and found that those judged to be better prepared for the future, through practices of scanning, interpreting and responding to change, achieved higher profitability and stronger growth in market value than firms that were less prepared. The study is observational, but it suggests that systematic attention to trends is associated with better performance.
Avoiding common errors
Several errors recur in trend work. Treating a short run of rising numbers as a trend ignores the tendency of small samples and short periods to produce striking but unrepresentative patterns, which Tversky and Kahneman (1971) described as the belief in the law of small numbers. Confusing attention with adoption overstates trends driven by media and social platforms. Extrapolating early growth rates indefinitely ignores the S-shaped path of diffusion. And relying on a single compelling story, rather than on evidence from several independent sources, repeats the error Tetlock (2005) found among the least accurate forecasters.
Key takeaways
Lasting shifts in consumer behaviour tend to follow S-shaped diffusion paths, rest on durable drivers such as changes in values, technology or demographics, and appear in behaviour across many groups and categories. Fads rise and fall quickly, often driven by novelty, social influence and attention. Because social influence makes popularity unpredictable and early growth can look similar for fads and real shifts, trend insight should rely on several independent sources of evidence, apply explicit tests, start from base rates and update as evidence accumulates. Responses should be scaled to the strength of the evidence, using monitoring, experiments and scenarios rather than single confident predictions.
References
Abrahamson, E. (1991). Managerial fads and fashions: The diffusion and rejection of innovations. Academy of Management Review, 16(3), 586–612. https://doi.org/10.5465/amr.1991.4279484
Abrahamson, E. (1996). Management fashion. Academy of Management Review, 21(1), 254–285. https://doi.org/10.5465/amr.1996.9602161572
Ansoff, H. I. (1975). Managing strategic surprise by response to weak signals. California Management Review, 18(2), 21–33. https://doi.org/10.2307/41164635
Bass, F. M. (1969). A new product growth for model consumer durables. Management Science, 15(5), 215–227. https://doi.org/10.1287/mnsc.15.5.215
Berger, J., & Le Mens, G. (2009). How adoption speed affects the abandonment of cultural tastes. Proceedings of the National Academy of Sciences, 106(20), 8146–8150. https://doi.org/10.1073/pnas.0812647106
Choi, H., & Varian, H. (2012). Predicting the present with Google Trends. Economic Record, 88(s1), 2–9. https://doi.org/10.1111/j.1475-4932.2012.00809.x
Cleveland, R. B., Cleveland, W. S., McRae, J. E., & Terpenning, I. (1990). STL: A seasonal-trend decomposition procedure based on loess. Journal of Official Statistics, 6(1), 3–73.
Day, G. S., & Schoemaker, P. J. H. (2006). Peripheral vision: Detecting the weak signals that will make or break your company. Harvard Business School Press.
Dedehayir, O., & Steinert, M. (2016). The hype cycle model: A review and future directions. Technological Forecasting and Social Change, 108, 28–41. https://doi.org/10.1016/j.techfore.2016.04.005
Fenn, J., & Raskino, M. (2008). Mastering the hype cycle: How to choose the right innovation at the right time. Harvard Business Press.
Ginsberg, J., Mohebbi, M. H., Patel, R. S., Brammer, L., Smolinski, M. S., & Brilliant, L. (2009). Detecting influenza epidemics using search engine query data. Nature, 457(7232), 1012–1014. https://doi.org/10.1038/nature07634
Hyndman, R. J., & Athanasopoulos, G. (2021). Forecasting: Principles and practice (3rd ed.). OTexts. https://otexts.com/fpp3/
Inglehart, R. (1997). Modernization and postmodernization: Cultural, economic, and political change in 43 societies. Princeton University Press.
Lazer, D., Kennedy, R., King, G., & Vespignani, A. (2014). The parable of Google Flu: Traps in big data analysis. Science, 343(6176), 1203–1205. https://doi.org/10.1126/science.1248506
Lieberson, S. (2000). A matter of taste: How names, fashions, and culture change. Yale University Press.
Moore, G. A. (1991). Crossing the chasm: Marketing and selling technology products to mainstream customers. HarperBusiness.
Rogers, E. M. (2003). Diffusion of innovations (5th ed.). Free Press.
Rohrbeck, R., & Kum, M. E. (2018). Corporate foresight and its impact on firm performance: A longitudinal analysis. Technological Forecasting and Social Change, 129, 105–116. https://doi.org/10.1016/j.techfore.2017.12.013
Salganik, M. J., Dodds, P. S., & Watts, D. J. (2006). Experimental study of inequality and unpredictability in an artificial cultural market. Science, 311(5762), 854–856. https://doi.org/10.1126/science.1121066
Schoemaker, P. J. H. (1995). Scenario planning: A tool for strategic thinking. Sloan Management Review, 36(2), 25–40.
Tetlock, P. E. (2005). Expert political judgment: How good is it? How can we know? Princeton University Press.
Tetlock, P. E., & Gardner, D. (2015). Superforecasting: The art and science of prediction. Crown.
Tversky, A., & Kahneman, D. (1971). Belief in the law of small numbers. Psychological Bulletin, 76(2), 105–110. https://doi.org/10.1037/h0031322
Wack, P. (1985). Scenarios: Uncharted waters ahead. Harvard Business Review, 63(5), 72–89.