
Insights · Generating insight
Emotional Insight: Measuring How Customers Feel
Why emotions matter for customer behaviour, how psychologists describe and measure them, the strengths and limits of self-report, experience sampling, text analysis, facial coding and physiological measures, and how to turn emotional data into insight.
Customers do not experience products and services only as bundles of features and prices. They feel frustrated when a delivery is late, relieved when a problem is resolved, proud of a purchase, anxious about a financial decision or delighted by an unexpected gesture. These feelings shape what customers remember, what they tell others and whether they come back. Yet much customer research measures only satisfaction and intention, which capture emotion indirectly at best.
This article explains why emotions matter for customer behaviour, how psychologists describe them, the main methods for measuring them and their limits, and how insight teams can turn emotional data into useful insight.
Why emotions matter
For a long time, emotion was seen as a source of error in decision making, something that interfered with rational choice. Research over the past few decades has changed this view. Damasio (1994) described patients with damage to brain regions involved in emotion who retained their reasoning abilities but made poor decisions in everyday life, and argued that emotional signals are an essential part of good judgement. Pham (2007) reviewed the evidence and concluded that emotions can both improve and impair decisions, depending on whether the feelings are relevant to the decision at hand.
Lerner et al. (2015) reviewed research on emotion and decision making and described how emotions influence choices in two ways. Integral emotions arise from the decision itself, such as anxiety about a risky investment. Incidental emotions are carried over from unrelated events, such as a bad mood from a delayed train, and can still influence judgements. Schwarz and Clore (1983) showed the second kind of effect in a classic study: people reported higher life satisfaction on sunny days than on rainy days, but the difference disappeared when their attention was drawn to the weather, suggesting that they had used their current mood as information about their lives in general.
In consumer behaviour, emotions play a central role in satisfaction and loyalty. Westbrook and Oliver (1991) found that patterns of emotional response during consumption were related to satisfaction, and Oliver (1993) showed that both positive and negative emotions contributed to satisfaction alongside judgements of product performance. Bagozzi et al. (1999) reviewed the role of emotions in marketing and described their influence on information processing, on responses to advertising, on satisfaction and on complaint and word-of-mouth behaviour. Baumeister et al. (2001) found across many areas of psychology that negative experiences tend to have stronger effects than positive ones, which means that negative emotions deserve particular attention in customer research.
Emotions also spread between people. Pugh (2001) studied interactions between bank employees and customers and found that employees' displays of positive emotion were associated with customers' positive mood after the encounter and with their evaluations of service quality. Customers' emotions are therefore shaped not only by what a company does but also by how its staff appear to feel while doing it. This is one reason why measures of employee experience and customer experience often move together, and why emotional insight can inform staff training and service design as well as product decisions.
The connection between emotion and satisfaction also explains why two customers who receive the same service can evaluate it very differently. Expectations, mood and the emotional tone of earlier moments all colour how an outcome is felt. A short delay may be shrugged off by a customer in a relaxed mood and resented by one who was already anxious. Measuring emotion alongside satisfaction helps separate the effect of the service itself from the state in which customers met it.
Describing emotions
There are two main ways of describing emotions, and each suggests a different approach to measurement.
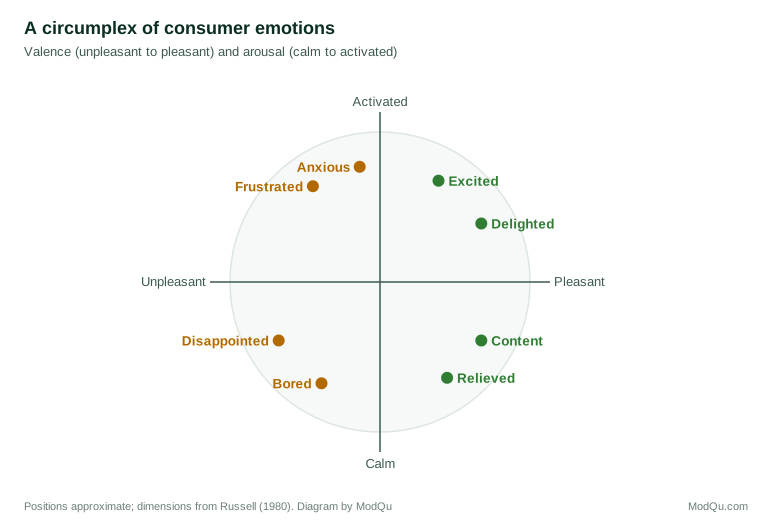
Dimensional models describe emotions by their position on a small number of underlying dimensions. Russell (1980) proposed that emotional states can be arranged in a circle defined by two dimensions: valence, from unpleasant to pleasant, and arousal, from calm to activated. Excitement is pleasant and high in arousal; contentment is pleasant and low in arousal; anger is unpleasant and high in arousal; sadness is unpleasant and low in arousal.
Discrete models describe emotions as distinct categories, such as anger, fear, joy and sadness. Ekman (1992) argued for a small set of basic emotions with distinctive causes, expressions and physiological patterns. Consumer researchers have developed sets of emotions relevant to consumption. Richins (1997) developed the Consumption Emotions Set, a list of emotion descriptors grouped into clusters such as anger, worry, contentment, joy and excitement, through a series of studies of consumers' experiences. Laros and Steenkamp (2005) proposed a hierarchy in which general positive and negative affect sit at the top, a small number of basic emotions sit in the middle, and many specific emotions sit at the bottom.
The two approaches are complementary. Dimensional measures are efficient and capture the overall tone of an experience; discrete measures are more specific and often more useful for diagnosing what has gone right or wrong. Knowing that customers felt "unpleasant, high arousal" is less actionable than knowing that they felt frustrated rather than anxious, because the two emotions call for different responses.
Self-report measures
The most direct way to learn how customers feel is to ask them. Self-report measures range from single questions to multi-item scales.
Rating scales ask respondents to rate how strongly they felt each of a list of emotions. The Positive and Negative Affect Schedule, developed by Watson et al. (1988), measures general positive and negative feeling with short lists of adjectives. Consumption-specific lists, such as those of Richins (1997), are more relevant to customer research.
Pictorial scales use images rather than words. The Self-Assessment Manikin, developed by Bradley and Lang (1994), uses simple figures to measure valence, arousal and dominance, and is quick to complete and less dependent on language.
Open-ended questions ask customers to describe how they felt in their own words. These often reveal emotions that structured lists miss, and the words customers use are themselves useful for communications.
Self-report has important limits. People may not be fully aware of what they felt or why. Nisbett and Wilson (1977) showed that people often cannot accurately report the influences on their judgements. Retrospective reports are shaped by memory. Redelmeier and Kahneman (1996) found that patients' later evaluations of uncomfortable procedures depended mainly on the most intense moment and the final moments, not on the total experience. And social desirability may lead people to under-report some emotions, such as embarrassment or envy. Mauss and Robinson (2009) reviewed the main methods for measuring emotion and concluded that self-report remains the best measure of subjective experience, but that different measures capture different aspects of emotion and often correlate only modestly with each other.
Measuring emotion in the moment
Because memory distorts emotional reports, methods that capture emotion closer to the experience can be more accurate.
Experience sampling, also called ecological momentary assessment, asks people to report their feelings at random or scheduled moments during their daily lives, usually through a mobile phone. Shiffman et al. (2008) reviewed this approach and described its advantages: it reduces recall bias, captures experience in natural settings and shows how feelings change over time and across situations.
The day reconstruction method, developed by Kahneman et al. (2004), asks people to reconstruct the previous day as a sequence of episodes and to report how they felt during each. It provides much of the detail of experience sampling with less burden on participants.
For customer research, these methods are well suited to studying ongoing experiences, such as using a product over several weeks, managing a household budget or travelling, where emotions vary across moments and situations.
Inferring emotion from text
Customers express emotions in reviews, complaints, social media posts, chat transcripts and open-ended survey responses. Sentiment analysis uses computational methods to classify such text as positive, negative or neutral, and in some cases to identify specific emotions. Pang and Lee (2008) reviewed the development of the field, and Hutto and Gilbert (2014) described a widely used rule-based method designed for short social media text.
Text analysis allows emotional reactions to be tracked across very large volumes of unsolicited feedback, which makes it valuable for detecting changes quickly. Its limits are also important. Automated methods often struggle with sarcasm, mixed feelings and domain-specific language; a "sick" product may be praised or criticised depending on the speaker. People who write reviews or post publicly are not representative of all customers, and extreme experiences are over-represented. Automated sentiment scores should therefore be validated against human coding for the specific type of text, and interpreted alongside other evidence.
Facial coding and physiological measures
Some methods attempt to measure emotion without asking. Facial coding systems analyse facial expressions, recorded on video, to infer emotions. Teixeira et al. (2012) used automated facial expression analysis and eye tracking while people watched online video advertisements and found that expressions of joy and surprise were associated with greater attention and with viewers being less likely to skip the advertisement.
The interpretation of facial expressions has, however, been seriously challenged. Barrett et al. (2019) reviewed a large body of research and concluded that people do not reliably display the same facial configurations when experiencing a given emotion, that the same configuration can express different emotions in different contexts, and that the meaning of facial movements varies across situations and cultures. Facial coding may detect movements reliably, but inferring specific emotions from them is much less certain than commercial claims often suggest.
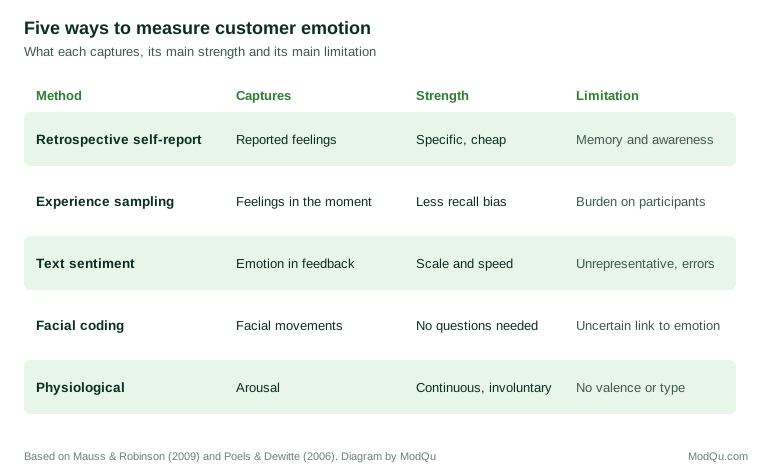
Physiological measures, such as heart rate, skin conductance and brain activity, are more closely related to arousal than to the specific emotion felt. They can show that something provoked a reaction, but not whether the reaction was pleasant or unpleasant without additional evidence. Poels and Dewitte (2006) reviewed two decades of emotion measurement in advertising research and concluded that different methods capture different aspects of emotional response, and that combining methods gives a more complete picture than any one alone.
Designing an emotion study
Several design choices determine whether an emotion study produces useful results.
Choose the right emotions. General lists of emotions include many that are irrelevant to a particular product or service, and omit some that matter. Qualitative research, such as interviews in which customers describe memorable experiences, helps identify the emotions that actually occur in a category. Richins (1997) developed the consumption emotion set in this way, starting from consumers' own descriptions and testing which emotions were relevant across many kinds of consumption. A study of a bank's mortgage process might need to measure anxiety, confusion, relief and pride; a study of a theme park might need excitement, boredom, frustration and delight.
Ask about specific episodes. Questions about how customers feel about a brand in general are dominated by overall attitudes. Questions about how they felt during a specific recent experience, such as their last delivery or their last call to customer service, produce more precise and more actionable answers. Asking customers to recall a particular occasion before rating their feelings also improves the accuracy of retrospective reports.
Measure close to the experience. The longer the gap between an experience and the question, the more the report reflects memory rather than experience. Short surveys triggered by a transaction, or in-the-moment methods, reduce this gap.
Include both positive and negative emotions. Positive and negative feelings are not simply opposite ends of one scale; customers often feel both during the same experience, such as excitement and anxiety about a large purchase. Measuring them separately captures this mixture, which a single satisfaction score hides.
Allow for intensity and frequency. It matters whether a negative emotion was intense and brief or mild and persistent. Asking about both, or measuring at several points, distinguishes a single bad moment from a pervasive problem.
Ethical considerations
Measuring emotion raises ethical questions that go beyond those of ordinary survey research. Methods that infer emotion without asking, such as facial coding, voice analysis or physiological monitoring, collect sensitive information that customers may not realise they are revealing. Their scientific basis for inferring specific emotions is contested (Barrett et al., 2019), so decisions based on them can be wrong as well as intrusive. Insight teams should obtain clear consent for any method that records faces, voices or bodily signals, explain how the data will be used, avoid using emotional inferences to make decisions about individual customers, and prefer methods in which customers report their own feelings wherever these are sufficient.
Turning emotional data into insight
Measuring emotion is only useful if it leads to understanding and action. Several practices help.
Link emotions to moments. An overall emotional score for a brand or service is hard to act on. Emotions measured at specific points in the customer journey, such as ordering, waiting, receiving and seeking help, show where experiences go wrong or right. Redelmeier and Kahneman's (1996) work on peak and end moments suggests paying particular attention to the most intense moment and to how an experience ends.
Distinguish specific emotions. Frustration, anxiety and disappointment are all negative, but they have different causes and call for different responses. Frustration often signals an obstacle that can be removed; anxiety often signals uncertainty that better information can reduce; disappointment often signals a gap between expectation and delivery.
Connect emotions to outcomes. Relating emotional measures to behaviour, such as repeat purchase, complaints, recommendations and cancellations, shows which emotions matter most for the business. This is the emotional equivalent of driver analysis.
Combine methods. Self-report captures what customers say they felt; behavioural and text data show how they acted and what they said spontaneously; in-the-moment methods reduce memory distortion. Where methods agree, confidence increases. Where they disagree, the disagreement is itself a finding to investigate.
Use customers' own words. The language customers use to describe their feelings is a valuable resource for designing communications and for helping staff understand what customers experience.
An example
Consider a hypothetical online furniture retailer whose satisfaction scores are reasonably good but whose repeat purchase rate is low. A study that asks customers to report their emotions at each stage of the journey, combined with analysis of the text of reviews and contact centre transcripts, finds that customers feel excited when ordering, increasingly anxious during the long wait for delivery when they receive little information, and frustrated if the delivery date changes. The final moments, assembly and the first days of use, are generally positive. Because anxiety during the wait is the most intense negative emotion, and because it arises from uncertainty, the retailer tests proactive delivery updates. Anxiety falls, contact centre calls about delivery fall, and repeat purchase rates among customers who received updates rise relative to a control group.
The example shows how specific emotions, linked to specific moments and connected to outcomes, lead to practical action that an overall satisfaction score would not have suggested.
It also shows the value of combining methods. The stage-by-stage survey identified when anxiety arose; the transcripts showed what customers were anxious about, mainly whether their delivery would arrive on the promised day; and the experiment showed that addressing it changed behaviour. No single method would have produced the full insight.
Key takeaways
Emotions shape customer satisfaction, memory, word of mouth and loyalty, and negative emotions usually weigh more heavily than positive ones. Emotions can be described by dimensions such as valence and arousal or as discrete categories such as frustration and joy. Self-report remains the best measure of what customers feel but is limited by awareness, memory and social desirability. Experience sampling and the day reconstruction method reduce memory distortion; text analysis provides scale; facial coding and physiological measures capture involuntary responses but have uncertain links to specific emotions. Emotional data become insight when emotions are linked to specific moments, distinguished from each other, connected to behaviour and examined through several methods together.
References
Bagozzi, R. P., Gopinath, M., & Nyer, P. U. (1999). The role of emotions in marketing. Journal of the Academy of Marketing Science, 27(2), 184–206. https://doi.org/10.1177/0092070399272005
Barrett, L. F., Adolphs, R., Marsella, S., Martinez, A. M., & Pollak, S. D. (2019). Emotional expressions reconsidered: Challenges to inferring emotion from human facial movements. Psychological Science in the Public Interest, 20(1), 1–68. https://doi.org/10.1177/1529100619832930
Baumeister, R. F., Bratslavsky, E., Finkenauer, C., & Vohs, K. D. (2001). Bad is stronger than good. Review of General Psychology, 5(4), 323–370. https://doi.org/10.1037/1089-2680.5.4.323
Bradley, M. M., & Lang, P. J. (1994). Measuring emotion: The self-assessment manikin and the semantic differential. Journal of Behavior Therapy and Experimental Psychiatry, 25(1), 49–59. https://doi.org/10.1016/0005-7916(94)90063-9
Damasio, A. R. (1994). Descartes' error: Emotion, reason, and the human brain. Putnam.
Ekman, P. (1992). An argument for basic emotions. Cognition and Emotion, 6(3–4), 169–200. https://doi.org/10.1080/02699939208411068
Hutto, C. J., & Gilbert, E. (2014). VADER: A parsimonious rule-based model for sentiment analysis of social media text. Proceedings of the International AAAI Conference on Web and Social Media, 8(1), 216–225. https://doi.org/10.1609/icwsm.v8i1.14550
Kahneman, D., Krueger, A. B., Schkade, D. A., Schwarz, N., & Stone, A. A. (2004). A survey method for characterizing daily life experience: The day reconstruction method. Science, 306(5702), 1776–1780. https://doi.org/10.1126/science.1103572
Laros, F. J. M., & Steenkamp, J.-B. E. M. (2005). Emotions in consumer behavior: A hierarchical approach. Journal of Business Research, 58(10), 1437–1445. https://doi.org/10.1016/j.jbusres.2003.09.013
Lerner, J. S., Li, Y., Valdesolo, P., & Kassam, K. S. (2015). Emotion and decision making. Annual Review of Psychology, 66, 799–823. https://doi.org/10.1146/annurev-psych-010213-115043
Mauss, I. B., & Robinson, M. D. (2009). Measures of emotion: A review. Cognition and Emotion, 23(2), 209–237. https://doi.org/10.1080/02699930802204677
Nisbett, R. E., & Wilson, T. D. (1977). Telling more than we can know: Verbal reports on mental processes. Psychological Review, 84(3), 231–259. https://doi.org/10.1037/0033-295X.84.3.231
Oliver, R. L. (1993). Cognitive, affective, and attribute bases of the satisfaction response. Journal of Consumer Research, 20(3), 418–430. https://doi.org/10.1086/209358
Pang, B., & Lee, L. (2008). Opinion mining and sentiment analysis. Foundations and Trends in Information Retrieval, 2(1–2), 1–135. https://doi.org/10.1561/1500000011
Pham, M. T. (2007). Emotion and rationality: A critical review and interpretation of empirical evidence. Review of General Psychology, 11(2), 155–178. https://doi.org/10.1037/1089-2680.11.2.155
Poels, K., & Dewitte, S. (2006). How to capture the heart? Reviewing 20 years of emotion measurement in advertising. Journal of Advertising Research, 46(1), 18–37. https://doi.org/10.2501/S0021849906060041
Pugh, S. D. (2001). Service with a smile: Emotional contagion in the service encounter. Academy of Management Journal, 44(5), 1018–1027. https://doi.org/10.5465/3069445
Redelmeier, D. A., & Kahneman, D. (1996). Patients' memories of painful medical treatments: Real-time and retrospective evaluations of two minimally invasive procedures. Pain, 66(1), 3–8. https://doi.org/10.1016/0304-3959(96)02994-6
Richins, M. L. (1997). Measuring emotions in the consumption experience. Journal of Consumer Research, 24(2), 127–146. https://doi.org/10.1086/209499
Russell, J. A. (1980). A circumplex model of affect. Journal of Personality and Social Psychology, 39(6), 1161–1178. https://doi.org/10.1037/h0077714
Schwarz, N., & Clore, G. L. (1983). Mood, misattribution, and judgments of well-being: Informative and directive functions of affective states. Journal of Personality and Social Psychology, 45(3), 513–523. https://doi.org/10.1037/0022-3514.45.3.513
Shiffman, S., Stone, A. A., & Hufford, M. R. (2008). Ecological momentary assessment. Annual Review of Clinical Psychology, 4, 1–32. https://doi.org/10.1146/annurev.clinpsy.3.022806.091415
Teixeira, T., Wedel, M., & Pieters, R. (2012). Emotion-induced engagement in internet video advertisements. Journal of Marketing Research, 49(2), 144–159. https://doi.org/10.1509/jmr.10.0207
Watson, D., Clark, L. A., & Tellegen, A. (1988). Development and validation of brief measures of positive and negative affect: The PANAS scales. Journal of Personality and Social Psychology, 54(6), 1063–1070. https://doi.org/10.1037/0022-3514.54.6.1063
Westbrook, R. A., & Oliver, R. L. (1991). The dimensionality of consumption emotion patterns and consumer satisfaction. Journal of Consumer Research, 18(1), 84–91. https://doi.org/10.1086/209243