
Surveys · Foundations and history
Why Surveys Still Matter in the Age of Big Data
Search queries, transactions and social media generate data on a scale no survey can match. Yet the most instructive failures of the big data era show why carefully designed surveys remain essential, and why the two work best together.
Every day people leave enormous trails of data: searches, purchases, clicks, posts, locations. Compared with this flood, a survey of a few thousand people can look slow, expensive and old-fashioned. It is tempting to conclude that surveys will soon be replaced by data that are generated automatically as a by-product of everyday life. Some sociologists predicted exactly that more than fifteen years ago (Savage & Burrows, 2007). The experience since then suggests a different conclusion.
What big data does well
Digital data have real advantages. They are often very large, nearly continuous and cheap to obtain once the systems exist. They record behaviour directly rather than relying on memory. For questions such as how many people visited a web page, bought a product or travelled along a road, records generated by the activity itself can be more accurate and timely than asking people to recall it. Groves (2011) called these "organic" data, as opposed to the "designed" data of surveys, and argued that the future of social measurement lies in using both.
Instructive failures
Size, however, does not guarantee accuracy. Google Flu Trends, launched in 2008, estimated influenza activity from the volume of related search queries and initially matched official surveillance data closely (Ginsberg et al., 2009). A few years later it was badly overestimating flu levels, at one point predicting more than double the share of doctor visits for influenza-like illness reported by health authorities. Lazer et al. (2014) traced the problem to changes in search behaviour and in the search engine itself, which altered the relationship between searches and illness. The data were vast but were not designed to measure flu, and nobody controlled how they were generated.
The same lesson appeared in the COVID-19 pandemic. Bradley et al. (2021) compared estimates of vaccine uptake in the United States from very large online surveys with official figures from the Centers for Disease Control and Prevention. Two surveys with tens or hundreds of thousands of responses each week overestimated uptake by double-digit margins, while a much smaller probability-based survey came far closer. The authors showed that a small correlation between willingness to respond and being vaccinated was enough to make an enormous sample worth very little.
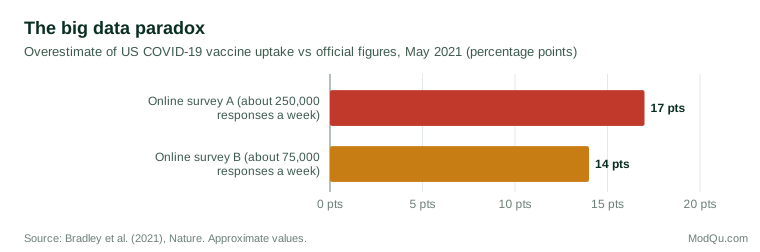
Meng (2018) gave this phenomenon a precise form. The error of an estimate depends on three things: the amount of data, the difficulty of the problem and a "data defect correlation" that measures how strongly being included in the data is related to the thing being measured. In a random sample this correlation is essentially zero. In self-selected data, even a tiny correlation is multiplied by the size of the population, so a huge non-random dataset can be less accurate than a small random sample. Meng called this the "big data paradox": the bigger the data, the surer we become of a wrong answer.
What surveys provide that other data cannot
Surveys remain essential for at least four reasons.
- Known coverage. A probability survey is designed so that its relationship to a defined population is known. Most digital data cover whoever happens to use a service, and that group changes over time.
- The things behind behaviour. Transaction records show what people bought but not why, what they considered instead or how satisfied they were. Attitudes, intentions, experiences and reasons can only be measured by asking.
- Stable measurement. A survey question can be asked the same way for decades. Platform data change whenever the platform changes, as Google Flu Trends showed.
- Benchmarks. Surveys provide the reference points against which other data are checked and adjusted. Without a trustworthy benchmark there is no way to tell whether a big data estimate is drifting.
boyd and Crawford (2012) warned that claims of objectivity and completeness in big data often hide the choices made in collecting and interpreting them. Kitchin (2014) similarly argued that large datasets do not remove the need for theory or careful research design.
Using both
The most productive response is integration rather than replacement. A task force of the American Association for Public Opinion Research concluded that big data can supplement surveys in many ways: providing auxiliary variables for sampling and weighting, filling gaps between survey waves and checking self-reports, provided the errors of each source are assessed (Japec et al., 2015). Amaya et al. (2020) extended the total survey error framework so that the same questions about coverage, measurement and processing can be asked of any data source. Couper (2013) concluded that surveys will need to change, becoming faster and better integrated with other data, but that the sky is not falling.
Integration works in both directions. Surveys can be linked, with consent, to purchase or usage records, so that self-reported satisfaction can be compared with what customers actually do next. Digital data can in turn identify which customers or places to survey, and when. A retailer that sees a sudden change in sales in one region can commission a quick survey to find out why, rather than guessing from the sales figures alone. In each case the designed data supply meaning and representativeness, while the organic data supply scale and timeliness.
For businesses, the practical message is simple. Behavioural data show what happened; well-designed surveys show who it happened to, how representative they are and why they acted as they did. Each answers questions the other cannot, and each is the best check on the other.
References
Amaya, A., Biemer, P. P., & Kinyon, D. (2020). Total error in a big data world: Adapting the TSE framework to big data. Journal of Survey Statistics and Methodology, 8(1), 89–119. https://doi.org/10.1093/jssam/smz056
boyd, d., & Crawford, K. (2012). Critical questions for big data: Provocations for a cultural, technological, and scholarly phenomenon. Information, Communication & Society, 15(5), 662–679. https://doi.org/10.1080/1369118X.2012.678878
Bradley, V. C., Kuriwaki, S., Isakov, M., Sejdinovic, D., Meng, X.-L., & Flaxman, S. (2021). Unrepresentative big surveys significantly overestimated US vaccine uptake. Nature, 600(7890), 695–700. https://doi.org/10.1038/s41586-021-04198-4
Couper, M. P. (2013). Is the sky falling? New technology, changing media, and the future of surveys. Survey Research Methods, 7(3), 145–156. https://doi.org/10.18148/srm/2013.v7i3.5751
Ginsberg, J., Mohebbi, M. H., Patel, R. S., Brammer, L., Smolinski, M. S., & Brilliant, L. (2009). Detecting influenza epidemics using search engine query data. Nature, 457(7232), 1012–1014. https://doi.org/10.1038/nature07634
Groves, R. M. (2011). Three eras of survey research. Public Opinion Quarterly, 75(5), 861–871. https://doi.org/10.1093/poq/nfr057
Japec, L., Kreuter, F., Berg, M., Biemer, P., Decker, P., Lampe, C., Lane, J., O'Neil, C., & Usher, A. (2015). Big data in survey research: AAPOR task force report. Public Opinion Quarterly, 79(4), 839–880. https://doi.org/10.1093/poq/nfv039
Kitchin, R. (2014). Big Data, new epistemologies and paradigm shifts. Big Data & Society, 1(1). https://doi.org/10.1177/2053951714528481
Lazer, D., Kennedy, R., King, G., & Vespignani, A. (2014). The parable of Google Flu: Traps in big data analysis. Science, 343(6176), 1203–1205. https://doi.org/10.1126/science.1248506
Meng, X.-L. (2018). Statistical paradises and paradoxes in big data (I): Law of large populations, big data paradox, and the 2016 US presidential election. The Annals of Applied Statistics, 12(2), 685–726. https://doi.org/10.1214/18-AOAS1161SF
Savage, M., & Burrows, R. (2007). The coming crisis of empirical sociology. Sociology, 41(5), 885–899. https://doi.org/10.1177/0038038507080443