
Surveys · Nonresponse, weighting and data quality
Using Paradata to Understand the Survey Response Process
Every survey produces data about how it was carried out, such as call records, response times and answer changes. This article explains what these paradata are, how they reveal problems with questions and fieldwork, and how they are used to improve surveys.
A survey produces two kinds of data. The first is the answers themselves: what respondents said about their health, their spending or their opinions. The second is a record of how those answers were obtained: when each household was called, how many attempts were needed, how long each question took, which answers were changed and on what device the questionnaire was completed. Couper (1998) named this second kind of data paradata. Once regarded as a technical by-product of computer-assisted fieldwork, paradata are now one of the main tools for understanding and improving surveys (Kreuter, 2013).
What counts as paradata
Paradata are data about the process of data collection. They are distinct from the survey answers and from metadata, which describe the survey as a whole, such as the questionnaire and the sample design. Figure 1 shows six common kinds.
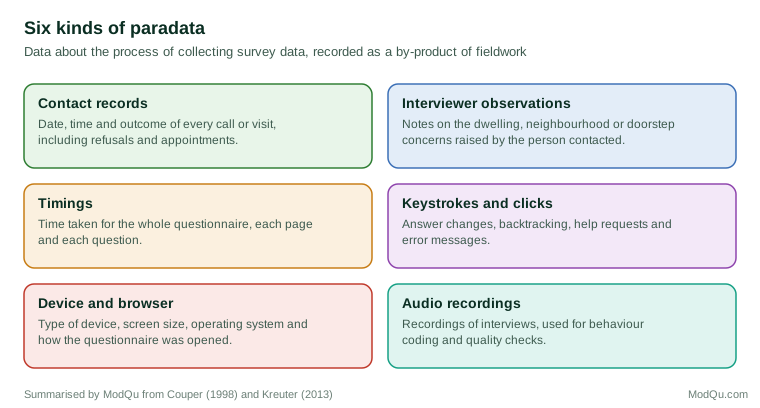
Some paradata are collected automatically. Computer-assisted interviewing systems record the time at which each screen is displayed and each answer entered. Web survey software can record clicks, answer changes and the device used, either on the server or in the respondent's browser (Heerwegh, 2003; Callegaro et al., 2015). Other paradata are recorded by interviewers, such as the outcome of each call and observations about the household.
Understanding the response process
Paradata show how respondents work through a questionnaire, which the answers alone cannot.
Response times are the most widely used. Long response times can indicate that a question is difficult to understand or that the information is hard to retrieve. Bassili and Scott (1996) showed that poorly worded questions took longer to answer. Yan and Tourangeau (2008) found that response times increased with question complexity and with respondents' age, and decreased with their experience of web surveys. Couper and Kreuter (2013) analysed times for individual items in a large face-to-face survey and found that they were related to question features, respondent characteristics and interviewers. Very short times can indicate the opposite problem: respondents who answer faster than they could read the question. Zhang and Conrad (2014) found that speeding was associated with straightlining, giving the same answer to every item in a grid.
Response latencies have a longer history in telephone surveys. Bassili and Fletcher (1991) measured the time between the end of a question and the start of the answer in computer-assisted telephone interviews. They found that people with strongly held attitudes answered more quickly, and that slow responses could signal weakly held views or uncertainty about the question. Latency can therefore add information about the strength of an opinion that the answer alone does not provide.
Answer changes show where respondents hesitate. Stern (2008) used client-side paradata to show that the visual layout of a question affected how often respondents changed their answers. Heerwegh (2003) found that answer changes and response times together could identify questions that respondents found confusing.
Breakoffs, where respondents start a questionnaire but do not finish it, can be located precisely using paradata. Peytchev (2009) showed that breakoffs clustered at particular questions, such as those presented in grids or requiring open answers, which pointed to specific design problems.
Monitoring and managing fieldwork
Contact records show how fieldwork is progressing. They reveal which kinds of household have been reached, how many attempts each case has received and when contact is most likely to succeed. Durrant et al. (2011) used call records to predict the best times to contact households, taking into account both household characteristics and interviewer behaviour.
Paradata also show diminishing returns. Figure 2 illustrates a common pattern: the first few call attempts produce most of the interviews, and later attempts add fewer at higher cost.
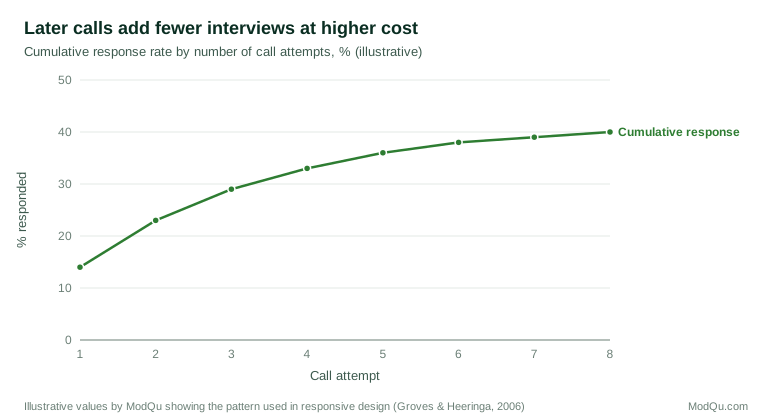
This information is the basis of responsive design, in which fieldwork is divided into phases and decisions about later phases are based on paradata from earlier ones (Groves & Heeringa, 2006). When paradata show that additional effort is no longer changing estimates or sample composition, the survey can switch to a different approach, such as a different mode or a larger incentive for a subsample of remaining cases. Kreuter, Couper, and Lyberg (2010) described how paradata can be displayed on dashboards that allow survey managers to monitor response, effort and cost during fieldwork.
Interviewer observations
In face-to-face surveys, interviewers are often asked to record observations about every sampled address, whether or not anyone responds. Typical observations include the type of dwelling, whether it has security features such as entry phones, signs of children and the condition of the neighbourhood. Because they are available for nonrespondents, these observations can support both fieldwork decisions and nonresponse adjustment. Their quality varies, however. West (2013) compared interviewer judgements with respondents' own reports and found that observations were often inaccurate and that errors were related to interviewers, which reduced their value for adjustment. Clear definitions, training and checks improve their usefulness.
Paradata by mode and device
The paradata available depend on the mode. Telephone surveys produce detailed call records and interview timings, and recordings where respondents consent. Face-to-face surveys add interviewer observations and, increasingly, location data from the devices interviewers carry, which show whether visits took place as reported. Web surveys produce the richest paradata about the response process itself, because every click and page change can be recorded, but very little about nonrespondents, who may never open the invitation. Paper questionnaires produce almost no paradata beyond the date of return.
Within web surveys, device paradata have become particularly important. Knowing whether a respondent used a smartphone, tablet or computer allows analysts to check whether completion times, breakoffs and answer patterns differ by device, and to adjust questionnaire design accordingly (Callegaro et al., 2015). Paradata can also show whether respondents leave the questionnaire to use other applications and return later, which affects the interpretation of total completion times.
Adjusting for nonresponse
Because paradata exist for both respondents and nonrespondents, they can be used in nonresponse adjustment. Call records, the number of attempts and interviewer observations of the dwelling are available for every sampled case. If they are related both to the likelihood of responding and to the survey's key variables, they can improve weights. Kreuter, Olson, et al. (2010) examined proxy measures and other paradata in several surveys and found that they were usually strongly related to response but often only weakly related to the survey's main variables, which limits their value for reducing bias. Observations designed to relate to the survey topic, such as signs of children in a household for a survey about children, are more useful than general observations (Kreuter, 2013).
Evaluating interviewers and data quality
Paradata help evaluate interviewers. Interview length, the pace of reading and the frequency of particular answers can be compared between interviewers. Interviewers who complete interviews far faster than their colleagues may be skipping text or, in rare cases, falsifying data. Audio recordings allow supervisors to check whether questions were read as written. Couper and Kreuter (2013) showed that interviewers accounted for part of the variation in item response times, indicating differences in how they administered questions.
In web surveys, paradata contribute to quality checks for careless responding. Completion times, answer patterns and device information help identify responses that should be reviewed or excluded (Callegaro et al., 2015; Zhang & Conrad, 2014).
Ethics and consent
Paradata raise questions about consent. Respondents agree to answer questions, but they may not expect their keystrokes, answer changes or device characteristics to be recorded. Couper and Singer (2013) found that asking for explicit consent to collect web paradata reduced participation, which creates a dilemma for researchers. Most survey organisations describe paradata collection in their privacy notices and limit the use of paradata to improving survey quality. Paradata, like survey answers, should be stored securely and should not be used to identify individual respondents outside the survey.
Using paradata well
Several practical lessons emerge from experience:
- Plan in advance. Decide which paradata will be collected and how they will be used before fieldwork, rather than analysing whatever happens to be recorded.
- Check quality. Interviewer-recorded paradata, such as call outcomes and observations, contain errors and should be checked in the same way as survey answers (Kreuter, 2013).
- Use paradata during fieldwork. Their greatest value often comes from changes made while the survey is still in the field.
- Combine sources. Response times, answer changes and breakoffs together give a clearer picture of question problems than any one alone.
- Respect privacy. Collect only what is needed and explain its use to respondents.
An example
A research company runs an online customer survey for a retailer. Paradata show that 15 per cent of respondents break off at a grid of twelve satisfaction items, that average time on that page is twice the time for comparable pages on smartphones, and that many smartphone respondents give the same answer to all twelve items. The company splits the grid into three short pages with item-by-item presentation on small screens. In the next wave, breakoffs at that point fall to 4 per cent and straightlining falls by half (illustrative example).
Conclusion
Paradata turn the process of data collection into evidence. Response times, answer changes and breakoffs show where respondents struggle; contact records show how fieldwork is progressing and where effort is being spent; and interviewer data show how consistently questions are administered. Used during fieldwork, paradata support responsive designs that balance cost and quality. Used after fieldwork, they inform nonresponse adjustment and the design of future surveys. Collected and analysed with care for respondents' privacy, paradata help survey researchers understand not only what people answered but how their answers came about.
References
Bassili, J. N., & Fletcher, J. F. (1991). Response-time measurement in survey research: A method for CATI and a new look at nonattitudes. Public Opinion Quarterly, 55(3), 331–346. https://doi.org/10.1086/269265
Bassili, J. N., & Scott, B. S. (1996). Response latency as a signal to question problems in survey research. Public Opinion Quarterly, 60(3), 390–399. https://doi.org/10.1086/297760
Callegaro, M., Lozar Manfreda, K., & Vehovar, V. (2015). Web survey methodology. SAGE. https://doi.org/10.4135/9781529799651
Couper, M. P., & Kreuter, F. (2013). Using paradata to explore item level response times in surveys. Journal of the Royal Statistical Society: Series A, 176(1), 271–286. https://doi.org/10.1111/j.1467-985X.2012.01041.x
Couper, M. P., & Singer, E. (2013). Informed consent for web paradata use. Survey Research Methods, 7(1), 57–67. https://doi.org/10.18148/srm/2013.v7i1.5138
Couper, M. P. (1998). Measuring survey quality in a CASIC environment. In Proceedings of the Survey Research Methods Section, American Statistical Association (pp. 41–49). American Statistical Association.
Durrant, G. B., D'Arrigo, J., & Steele, F. (2011). Using paradata to predict best times of contact, conditioning on household and interviewer influences. Journal of the Royal Statistical Society: Series A, 174(4), 1029–1049. https://doi.org/10.1111/j.1467-985X.2011.00715.x
Groves, R. M., & Heeringa, S. G. (2006). Responsive design for household surveys: Tools for actively controlling survey errors and costs. Journal of the Royal Statistical Society: Series A, 169(3), 439–457. https://doi.org/10.1111/j.1467-985X.2006.00423.x
Heerwegh, D. (2003). Explaining response latencies and changing answers using client-side paradata from a web survey. Social Science Computer Review, 21(3), 360–373. https://doi.org/10.1177/0894439303253985
Kreuter, F., Couper, M. P., & Lyberg, L. E. (2010). The use of paradata to monitor and manage survey data collection. In Proceedings of the Survey Research Methods Section, American Statistical Association (pp. 282–296). American Statistical Association.
Kreuter, F. (Ed.). (2013). Improving surveys with paradata: Analytic uses of process information. Wiley. https://doi.org/10.1002/9781118596869
Kreuter, F., Olson, K., Wagner, J., Yan, T., Ezzati-Rice, T. M., Casas-Cordero, C., Lemay, M., Peytchev, A., Groves, R. M., & Raghunathan, T. E. (2010). Using proxy measures and other correlates of survey outcomes to adjust for non-response: Examples from multiple surveys. Journal of the Royal Statistical Society: Series A, 173(2), 389–407. https://doi.org/10.1111/j.1467-985X.2009.00621.x
Peytchev, A. (2009). Survey breakoff. Public Opinion Quarterly, 73(1), 74–97. https://doi.org/10.1093/poq/nfp014
Stern, M. J. (2008). The use of client-side paradata in analyzing the effects of visual layout on changing responses in web surveys. Field Methods, 20(4), 377–398. https://doi.org/10.1177/1525822X08320421
West, B. T. (2013). An examination of the quality and utility of interviewer observations in the National Survey of Family Growth. Journal of the Royal Statistical Society: Series A, 176(1), 211–225. https://doi.org/10.1111/j.1467-985X.2012.01038.x
Yan, T., & Tourangeau, R. (2008). Fast times and easy questions: The effects of age, experience and question complexity on web survey response times. Applied Cognitive Psychology, 22(1), 51–68. https://doi.org/10.1002/acp.1331
Zhang, C., & Conrad, F. G. (2014). Speeding in web surveys: The tendency to answer very fast and its association with straightlining. Survey Research Methods, 8(2), 127–135. https://doi.org/10.18148/srm/2014.v8i2.5453