
Surveys · Nonresponse, weighting and data quality
Longitudinal Panel Attrition: Implications for Continuous Knowledge Generation
Panel surveys follow the same people over time, which allows researchers to study change directly. Each wave, some members drop out. This article explains why attrition happens, how it can bias results, and how panels can reduce it and adjust for it.
A panel survey interviews the same people repeatedly over months or years. This design makes it possible to see how individuals change: who moves into and out of work, how attitudes shift after an event, how health develops with age. Cross-sectional surveys, which interview a new sample each time, can show changes in the population as a whole but cannot show which people changed or why (Duncan & Kalton, 1987; Lynn, 2009). Panels are therefore a central source of continuous knowledge for governments, academics and businesses.
Panels share one persistent weakness. Every wave, some members do not take part. Some cannot be found because they have moved; some decline; some become too ill or die. This loss is called attrition. Over many waves, attrition can remove a large share of the original sample. If those who leave differ from those who stay, the panel gradually ceases to represent the population it started with, and estimates of both levels and change can be biased (Fitzgerald et al., 1998; Lynn & Lugtig, 2017). This article explains why attrition happens, how it affects results and what can be done about it.
Patterns of attrition
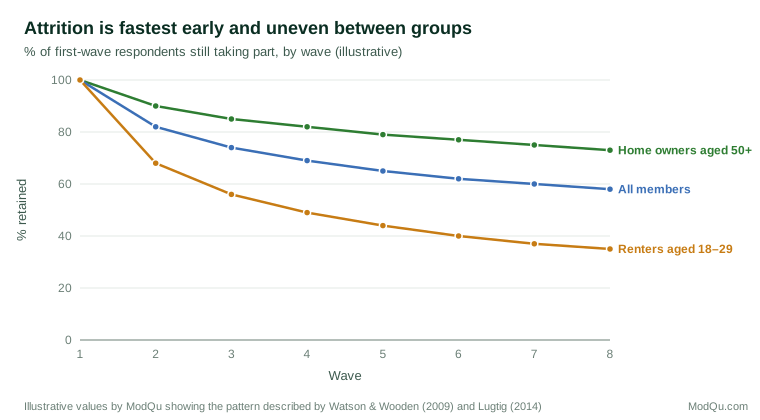
Attrition is usually highest between the first and second waves and slows thereafter, as the members who remain become those most committed to the study (Lepkowski & Couper, 2002). It is also uneven between groups. Younger people, renters, people who move often, people with lower incomes and members of some minority groups tend to leave at higher rates (Watson & Wooden, 2009; Uhrig, 2008). Figure 1 illustrates these patterns.
Attrition is not always permanent. Many members miss one wave and return in a later one. Lugtig (2014) identified distinct patterns of participation in a panel: stayers who always respond, fast attriters who leave early, gradual attriters whose participation fades over time, and "lurkers" who respond irregularly. Each group may have different reasons for its behaviour and may call for different retention strategies.
Why members leave
Lepkowski and Couper (2002) distinguished three steps that must succeed for a panel member to respond in a later wave: the member must be located, contacted and must cooperate. Each step can fail.
Location. People move house, change telephone numbers and email addresses, and sometimes leave no forwarding information. Mobile groups, such as young adults and renters, are particularly hard to follow (Couper & Ofstedal, 2009).
Contact. Even when the address is known, members may be hard to reach, especially if their working hours or household circumstances change.
Cooperation. Members may lose interest, find the interviews burdensome, be dissatisfied with a previous interview or feel they have already given enough. The experience of earlier waves matters: members who found a previous interview long or unpleasant are more likely to decline later (Watson & Wooden, 2009).
Life events affect all three steps. Moving house, separation, a new job, illness and the birth of a child can each disrupt participation. Because these events are often the very changes a panel is designed to study, attrition linked to them is a particular concern.
How attrition biases results
Attrition can bias two kinds of estimate.
Estimates of levels. If people with lower incomes are more likely to leave, later waves will overstate average income, just as nonresponse in a cross-sectional survey would.
Estimates of change. Panels exist to measure change, and attrition can bias these estimates too. If people whose circumstances deteriorate are more likely to drop out, a panel will understate how often circumstances deteriorate. Hausman and Wise (1979) showed that attrition related to the outcome being studied can bias estimates in panel experiments.
The size of the bias varies. Fitzgerald et al. (1998) examined attrition in a long-running United States household panel that had lost about half its original sample and found that, although those who left differed from those who stayed, estimates of many relationships, such as the determinants of earnings, were only modestly affected. Studies of other panels have reached similar conclusions for some estimates and found substantial bias for others (Vandecasteele & Debels, 2007). The effect depends on how strongly attrition is related to the variables being analysed.
Attrition can also distort comparisons between groups. If young members leave faster than older members, later waves contain fewer young people, and the young people who remain are those most willing to take part, who may be more settled or more engaged than their peers. Comparisons of change between age groups then mix real differences with differences in who stayed. Analysts should therefore check whether conclusions about group differences hold when the analysis is restricted to members who took part in every wave, and whether they hold after attrition weighting.
A related issue is panel conditioning: taking part in a panel can change members' behaviour or answers. People asked repeatedly about voting may become more interested in politics; people asked about saving may begin to save. Warren and Halpern-Manners (2012) reviewed the evidence and found that conditioning effects exist for some topics, which means that those who remain in a panel may differ from the population not only because of who stayed but because of what taking part did to them.
Reducing attrition
Panels use a range of strategies to keep members, summarised in Figure 2 (Laurie et al., 1999; Couper & Ofstedal, 2009; Fumagalli et al., 2013).
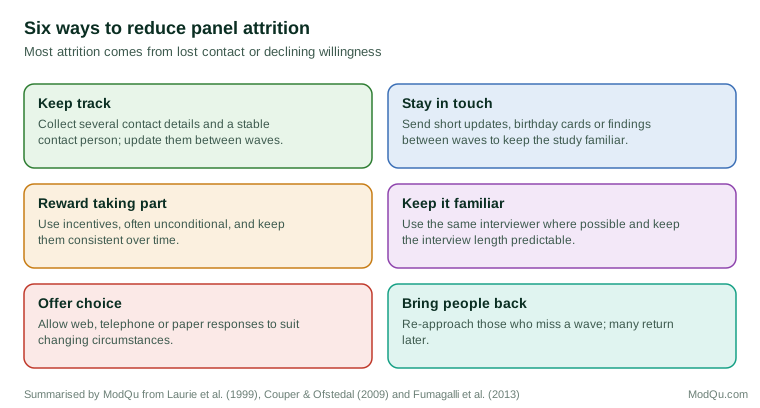
Tracking. Collecting several forms of contact information, including details of a friend or relative who will know where the member has moved, makes it possible to find people who change address. Panels also use change-of-address cards, postal redirection services and searches of public records (Couper & Ofstedal, 2009).
Between-wave contact. Brief contacts between waves, such as newsletters with study findings, birthday cards or requests to confirm contact details, keep members engaged and allow address changes to be caught early. Fumagalli et al. (2013) tested several between-wave mailings in a household panel and found that some tailored approaches modestly improved retention, particularly among young people.
Incentives. Incentives encourage continued participation. Laurie and Lynn (2009) reviewed the use of incentives in longitudinal surveys and found that they generally improve retention, that unconditional incentives tend to work better than conditional ones and that reducing or removing an established incentive can harm response.
Interviewer continuity. Using the same interviewer at each wave can build rapport and trust, though the evidence on its effect is mixed (Watson & Wooden, 2009).
Flexible modes. Offering web, telephone and paper alternatives allows members whose circumstances change to continue taking part. Many panels have moved towards mixed-mode designs for this reason (Lynn, 2009).
Persistent follow-up. Members who miss a wave should usually be approached again in later waves, because many return. Treating a single missed wave as permanent withdrawal unnecessarily increases attrition (Lugtig, 2014).
Positive experience. Keeping interviews to a reasonable length, avoiding repetitive questions and showing members how their information is used all improve willingness to continue (Laurie et al., 1999).
Adjusting for attrition
When attrition cannot be prevented, adjustments can reduce its effects. Panels have an advantage over cross-sectional surveys here: they have information from earlier waves about the members who leave. This allows attrition weights to be calculated from a model of the probability of remaining in the panel, using a rich set of earlier answers. Members similar to those who left receive higher weights (Kalton et al., 1989; Vandecasteele & Debels, 2007).
Missing waves can also be imputed, using a member's earlier and later answers along with those of similar members (Little & Rubin, 2019). Statistical models for longitudinal data can make use of all available waves for each member rather than discarding those with incomplete histories.
These adjustments work only to the extent that the reasons for attrition are captured by information collected before members leave. If people leave because of an event that happens between waves and is not recorded, such as a sudden loss of income, adjustments based on earlier waves will not fully correct the bias.
Targeting effort where it matters
Retention effort is expensive, and not every member is equally at risk of leaving or equally important for the panel's estimates. Panels increasingly use information from earlier waves to predict which members are likely to leave and to direct extra effort to them. This is an application of responsive design, in which fieldwork is adjusted during data collection using information about how it is going (Groves & Heeringa, 2006). A panel might offer a higher incentive, an earlier reminder or a telephone call instead of a letter to members whose predicted probability of responding is low, especially if they belong to groups that are already under-represented. Experiments with such targeted approaches have found that they can improve retention among hard-to-retain groups at modest cost, although the gains are usually a few percentage points rather than a transformation (Fumagalli et al., 2013).
Online panels
Many organisations now run online panels whose members answer short surveys frequently, sometimes weekly. Two kinds should be distinguished. Probability-based online panels recruit members through a random sample, often by mail or telephone, and provide internet access to those without it, so that the panel represents the population. Scherpenzeel and Das (2010) described one such panel in the Netherlands and its efforts to maintain participation over time. Opt-in access panels recruit volunteers and are used mainly to supply samples for individual surveys rather than to follow the same people over time (Callegaro et al., 2014).
For both kinds, attrition takes a particular form. Members rarely announce that they are leaving; they simply stop responding to invitations, or respond less and less often. Lugtig (2014), studying a Dutch probability-based panel, found that gradual disengagement was common and that different patterns of attrition were linked to different member characteristics. Panels can reduce disengagement by limiting how often members are invited, keeping surveys short and varied and removing inactive members only after repeated attempts to re-engage them.
Consent and withdrawal
Panel members agree to take part over a long period, and their circumstances and willingness can change. Good practice is to remind members at regular intervals that participation is voluntary, to make it easy to pause or withdraw, and to explain how data already collected will be used if they leave. Respecting withdrawal promptly builds trust among those who remain. Some panels distinguish between members who wish to stop answering surveys but allow their earlier data to be used and those who wish their data to be removed, and record these choices carefully.
Refreshment samples
Over long periods, attrition and changes in the population, such as immigration and births, mean that the original panel no longer represents the current population. Many panels add refreshment samples, new members selected to represent the population at the time of joining. Refreshment samples restore sample size and representativeness and also allow researchers to estimate attrition bias by comparing new and continuing members (Lynn, 2009; Schoeni et al., 2013).
Implications for continuous knowledge
For organisations that rely on panels for continuous knowledge, such as tracking consumer behaviour or employee attitudes over time, attrition has several practical implications.
- Monitor retention by group. Overall retention can hide large differences between groups. Tracking retention by age, region, tenure and other characteristics shows where problems are developing.
- Compare stayers and leavers. Using earlier waves, compare those who leave with those who stay on key measures. Large differences signal a risk of bias.
- Separate change from composition. When reporting trends, check whether apparent changes reflect real change among continuing members or simply a change in who remains.
- Plan for refreshment. Budget for regular refreshment samples and decide how they will be integrated into weights and trends.
- Report attrition openly. Publish retention rates and describe adjustments, so users can judge the reliability of longitudinal estimates (Lynn & Lugtig, 2017).
An example
A consumer panel tracks spending habits each quarter. After two years, 55 per cent of the original members remain. Retention is 75 per cent among home owners over 50 but only 35 per cent among renters under 30. Comparing first-wave answers, the team finds that those who left were more likely to report financial difficulties and frequent moves. Without adjustment, the panel would show a steady improvement in household finances that is partly an artefact of losing financially stressed members. The team introduces attrition weights based on first-wave characteristics, increases incentives and between-wave contact for younger renters, and adds a refreshment sample of 1,000 members. After these changes, the reported improvement in household finances is about half as large as the unadjusted panel suggested (illustrative example).
Conclusion
Panel surveys provide unique knowledge about how individuals change over time, but attrition steadily erodes their samples. Members are lost when they cannot be located, contacted or persuaded to continue, and losses are greater among mobile, younger and less advantaged groups. Attrition can bias estimates of both levels and change, sometimes modestly and sometimes substantially. Tracking, between-wave contact, incentives, flexible modes and persistent follow-up reduce attrition; attrition weights, imputation and refreshment samples reduce its effects. Monitoring and reporting attrition openly allow users to judge how far a panel's continuous knowledge can be trusted.
References
Callegaro, M., Baker, R., Bethlehem, J., Göritz, A. S., Krosnick, J. A., & Lavrakas, P. J. (Eds.). (2014). Online panel research: A data quality perspective. Wiley. https://doi.org/10.1002/9781118763520
Couper, M. P., & Ofstedal, M. B. (2009). Keeping in contact with mobile sample members. In P. Lynn (Ed.), Methodology of longitudinal surveys (pp. 183–203). Wiley. https://doi.org/10.1002/9780470743874.ch11
Duncan, G. J., & Kalton, G. (1987). Issues of design and analysis of surveys across time. International Statistical Review, 55(1), 97–117. https://doi.org/10.2307/1403273
Fitzgerald, J., Gottschalk, P., & Moffitt, R. (1998). An analysis of sample attrition in panel data: The Michigan Panel Study of Income Dynamics. The Journal of Human Resources, 33(2), 251–299. https://doi.org/10.2307/146433
Fumagalli, L., Laurie, H., & Lynn, P. (2013). Experiments with methods to reduce attrition in longitudinal surveys. Journal of the Royal Statistical Society: Series A, 176(2), 499–519. https://doi.org/10.1111/j.1467-985X.2012.01051.x
Groves, R. M., & Heeringa, S. G. (2006). Responsive design for household surveys: Tools for actively controlling survey errors and costs. Journal of the Royal Statistical Society: Series A, 169(3), 439–457. https://doi.org/10.1111/j.1467-985X.2006.00423.x
Hausman, J. A., & Wise, D. A. (1979). Attrition bias in experimental and panel data: The Gary income maintenance experiment. Econometrica, 47(2), 455–473. https://doi.org/10.2307/1914193
Kalton, G., Kasprzyk, D., & McMillen, D. B. (1989). Nonsampling errors in panel surveys. In D. Kasprzyk, G. Duncan, G. Kalton, & M. P. Singh (Eds.), Panel surveys (pp. 249–270). Wiley.
Laurie, H., & Lynn, P. (2009). The use of respondent incentives on longitudinal surveys. In P. Lynn (Ed.), Methodology of longitudinal surveys (pp. 205–233). Wiley. https://doi.org/10.1002/9780470743874.ch12
Laurie, H., Smith, R., & Scott, L. (1999). Strategies for reducing nonresponse in a longitudinal panel survey. Journal of Official Statistics, 15(2), 269–282.
Lepkowski, J. M., & Couper, M. P. (2002). Nonresponse in the second wave of longitudinal household surveys. In R. M. Groves, D. A. Dillman, J. L. Eltinge, & R. J. A. Little (Eds.), Survey nonresponse (pp. 259–272). Wiley.
Little, R. J. A., & Rubin, D. B. (2019). Statistical analysis with missing data (3rd ed.). Wiley. https://doi.org/10.1002/9781119482260
Lugtig, P. (2014). Panel attrition: Separating stayers, fast attriters, gradual attriters, and lurkers. Sociological Methods & Research, 43(4), 699–723. https://doi.org/10.1177/0049124113520305
Lynn, P., & Lugtig, P. (2017). Total survey error for longitudinal surveys. In P. P. Biemer, E. de Leeuw, S. Eckman, B. Edwards, F. Kreuter, L. E. Lyberg, N. C. Tucker, & B. T. West (Eds.), Total survey error in practice (pp. 279–298). Wiley. https://doi.org/10.1002/9781119041702.ch13
Lynn, P. (Ed.). (2009). Methodology of longitudinal surveys. Wiley. https://doi.org/10.1002/9780470743874
Scherpenzeel, A. C., & Das, M. (2010). "True" longitudinal and probability-based internet panels: Evidence from the Netherlands. In M. Das, P. Ester, & L. Kaczmirek (Eds.), Social and behavioral research and the internet: Advances in applied methods and research strategies (pp. 77–104). Routledge.
Schoeni, R. F., Stafford, F., McGonagle, K. A., & Andreski, P. (2013). Response rates in national panel surveys. The Annals of the American Academy of Political and Social Science, 645(1), 60–87. https://doi.org/10.1177/0002716212456363
Uhrig, S. C. N. (2008). The nature and causes of attrition in the British Household Panel Survey (ISER Working Paper No. 2008-05). Institute for Social and Economic Research, University of Essex.
Vandecasteele, L., & Debels, A. (2007). Attrition in panel data: The effectiveness of weighting. European Sociological Review, 23(1), 81–97. https://doi.org/10.1093/esr/jcl021
Warren, J. R., & Halpern-Manners, A. (2012). Panel conditioning in longitudinal social science surveys. Sociological Methods & Research, 41(4), 491–534. https://doi.org/10.1177/0049124112460374
Watson, N., & Wooden, M. (2009). Identifying factors affecting longitudinal survey response. In P. Lynn (Ed.), Methodology of longitudinal surveys (pp. 157–181). Wiley. https://doi.org/10.1002/9780470743874.ch10