
Surveys · Nonresponse, weighting and data quality
The Impact of Interviewer Effects on Knowledge Generation in Telephone Surveys
In a telephone survey, every answer passes through an interviewer. This article explains how interviewers can influence who takes part and what respondents say, how these interviewer effects are measured, and how survey organisations reduce them.
A telephone survey is a conversation. The interviewer reads the questions, listens to the answers, clarifies when asked, probes when an answer is incomplete and records what was said. Interviewers make telephone surveys possible: they persuade people to take part, keep respondents engaged and help them through complex questions. But because each interviewer works in a slightly different way, interviewers are also a source of error. The answers recorded by one interviewer may differ systematically from those recorded by another, even when both interview similar people.
These interviewer effects have been studied since the earliest days of survey research (Kish, 1962; Cannell et al., 1981). They matter for knowledge generation because they are usually invisible in the data. A survey estimate looks the same whether it was produced by fifty interviewers working consistently or by fifty interviewers each nudging answers in a different direction. Only the design of the survey and the analysis of the data can show how large interviewer effects are and how much they reduce the precision of the results.
This article explains what interviewer effects are, why they arise, how they are measured and how survey organisations reduce them in telephone surveys.
What are interviewer effects?
Survey methodologists distinguish two kinds of interviewer effect (Groves, 1989; Biemer & Lyberg, 2003).
Interviewer bias is a systematic effect shared by all or most interviewers. If all interviewers in a survey are young women, for example, and respondents answer questions about gender roles differently when speaking to young women, the estimate is shifted in one direction. Interviewer bias cannot be detected by comparing interviewers within the survey, because they all have the same effect. It can be detected only by comparing interviewer-administered data with data from another mode or by varying interviewer characteristics experimentally.
Interviewer variance arises when interviewers differ from one another. One interviewer may probe more often, another may read a question with a slightly different emphasis, and a third may accept "don't know" more readily. Each interviewer's respondents then give answers that are more similar to one another than they would be if interviewers had no effect. This clustering of answers by interviewer increases the variance of survey estimates, in the same way that cluster sampling does.
Interviewers can also influence who is interviewed. Some interviewers are much more successful than others at gaining cooperation, and the people they persuade may differ from those persuaded by less successful colleagues. Differences between interviewers in their respondents' answers may therefore reflect differences in who responded, not only differences in how questions were asked (West & Olson, 2010).
How interviewer variance is measured
The standard measure of interviewer variance is the intra-interviewer correlation, usually written ρ (rho). It is the share of the total variance in a variable that is due to differences between interviewers. A value of zero means that interviewers have no effect; a value of 0.01 means that 1 per cent of the variance is associated with interviewers (Kish, 1962).
Values of ρ are usually small. In centralised telephone surveys, Groves and Magilavy (1986) found that most questions had values below 0.02, with an average close to 0.01. Tucker (1983) reported similar values for telephone interviewers. Values in face-to-face surveys tend to be somewhat larger, partly because interviewers work in different areas and partly because supervision is harder (O'Muircheartaigh & Campanelli, 1998; Schnell & Kreuter, 2005).
Small values of ρ can still matter, because their effect depends on how many interviews each interviewer conducts. The increase in variance due to interviewers is approximately
1 + ρ(m − 1)
where m is the average number of interviews per interviewer (Kish, 1962; Groves, 1989). This is the same form as the design effect for cluster sampling. In telephone surveys, where each interviewer may complete 50 or 100 interviews, even a ρ of 0.01 can increase the variance of an estimate by half or more. Figure 1 shows how variance inflation grows with workload for three values of ρ.
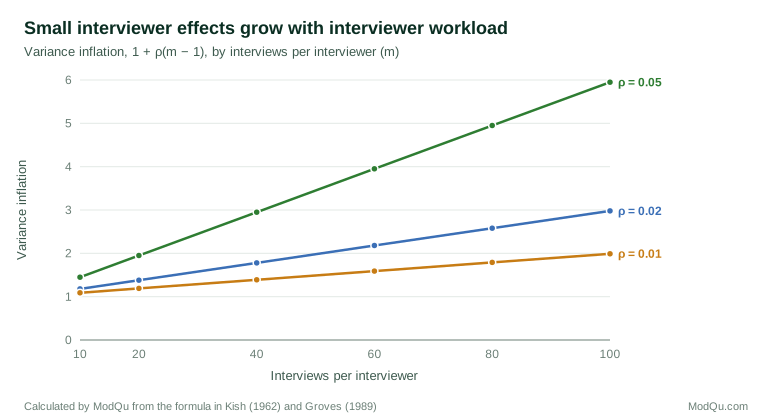
With ρ = 0.02 and 80 interviews per interviewer, the variance more than doubles. A sample of 2,000 interviews then gives estimates no more precise than a sample of about 800 with no interviewer effects. Standard errors calculated without taking interviewers into account will be too small, and confidence intervals too narrow. Elliott and West (2015) showed that many health surveys using single-stage telephone samples ignore this clustering by interviewer, even though it can affect conclusions.
Separating interviewer effects from other sources
Estimating ρ requires that differences between interviewers can be separated from differences between the respondents they interview. In centralised telephone facilities, this is possible through interpenetrated assignment: cases are allocated to interviewers at random, so that each interviewer receives a comparable set of respondents. Any remaining differences between interviewers' results can then be attributed to the interviewers (Kish, 1962; Groves & Magilavy, 1986).
In practice, random assignment is rarely complete. Interviewers work different shifts, and people reached in the evening or at weekends differ from those reached during the day. Some interviewers specialise in converting refusals or in interviewing in particular languages. Analysts therefore use multilevel models, which treat respondents as nested within interviewers and estimate the variance at each level while controlling for respondent characteristics and shift (Hox, 1994).
Interviewer effects on measurement must also be separated from effects on nonresponse. West and Olson (2010) linked survey responses to administrative records for both respondents and nonrespondents. They found that, for some variables, a substantial part of what appeared to be interviewer variance in measurement was in fact variance in which people each interviewer recruited. Brunton-Smith et al. (2012) found that interviewers who were more successful at gaining cooperation did not necessarily produce larger measurement effects, suggesting that the two skills are partly distinct.
Why interviewers differ
Interviewer effects arise from both who the interviewer is and what the interviewer does.
Interviewer behaviour
Standardised interviewing requires interviewers to read questions exactly as worded, to probe in a neutral way, to provide only scripted clarification and to record answers without interpretation (Fowler & Mangione, 1990). Studies that record and code interviews show that interviewers often depart from these rules. They change question wording, skip parts of questions they believe to be redundant, suggest answers, or accept inadequate responses (Cannell et al., 1981; Schaeffer et al., 2010). Each of these behaviours can vary between interviewers and so contributes to interviewer variance.
Pace also matters. Interviewers who read quickly give respondents less time to think, which can lead to less careful answers. Olson and Peytchev (2007) found that interviewers became faster as they gained experience during a survey and that their attitudes towards the task changed. Olson and Bilgen (2011) found that respondents of more experienced interviewers showed more acquiescence, agreeing with statements regardless of content, possibly because experienced interviewers moved through questions more quickly.
Interviewer characteristics
Respondents may adjust their answers to what they think the interviewer would like to hear, particularly on topics related to the interviewer's apparent characteristics. On the telephone, respondents cannot see the interviewer, but they can often infer sex, age and sometimes race or ethnicity from voice, accent and name.
Several studies show race-of-interviewer effects in telephone surveys. Cotter et al. (1982) found that answers to questions on racial issues differed depending on whether the respondent perceived the interviewer to be Black or White. Finkel et al. (1991) found that, in a pre-election poll, White respondents interviewed by Black interviewers expressed more support for a Black candidate than those interviewed by White interviewers. Similarly, Kane and Macaulay (1993) found that both men and women gave more egalitarian answers to questions about gender inequality when interviewed by women. Effects of this kind are forms of interviewer bias and are largest on questions related to the characteristic concerned.
Question characteristics
Interviewer effects are not equally large for all questions. Mangione et al. (1992) found larger effects for questions that were sensitive, open-ended or difficult, and for questions that required interviewers to probe. Simple factual questions, such as age, show very small effects. Figure 2 illustrates the typical pattern.
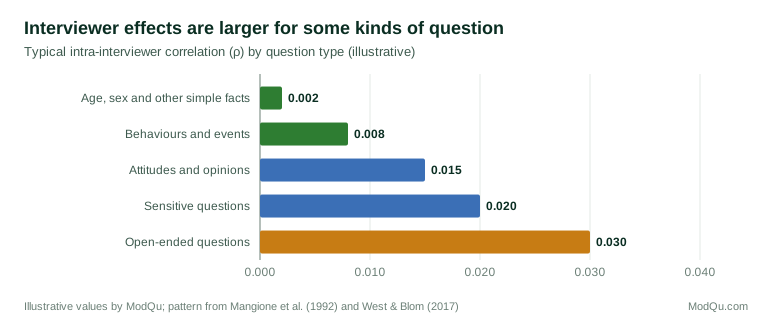
The pattern is consistent with the idea that interviewers have more influence when respondents are uncertain, when the task requires interpretation or when the answer has to be recorded in the interviewer's own words. A research synthesis by West and Blom (2017) concluded that interviewer effects are found across many surveys and countries, that they are larger for attitudinal and sensitive items than for factual items, and that interviewer characteristics explain only part of them.
Interviewers and nonresponse
Interviewers' first task in a telephone survey is to persuade someone to take part. The first seconds of a call are critical, and interviewers vary widely in their success. Oksenberg et al. (1986) found that interviewers with lower refusal rates had voices that listeners rated as more competent and confident, with higher pitch and greater variation in pitch, and spoke somewhat faster and louder. Groves et al. (2008) also found that voice characteristics, together with the content of the introduction, were related to whether people agreed to take part.
Attitudes matter as well. Durrant et al. (2010) found that interviewers who were more confident and who believed that reluctant respondents could be persuaded achieved lower refusal rates. Interviewers who tailor their introduction to the person they are speaking to, responding to concerns rather than repeating a script, tend to be more successful (Groves et al., 2009).
Differences in cooperation rates between interviewers are important for knowledge generation in two ways. First, they affect the overall response rate and so the cost of the survey. Second, if more successful interviewers bring in different kinds of respondents, survey estimates may depend partly on which interviewers worked on the survey. West and Olson (2010) showed that this nonresponse error variance can be a substantial part of what appears in the data as interviewer variance.
Telephone compared with face-to-face interviewing
Telephone surveys have several advantages over face-to-face surveys with respect to interviewer effects. Interviewers usually work from centralised facilities where supervisors can listen to calls, provide immediate feedback and correct departures from the script. Computer-assisted telephone interviewing controls the order of questions, routing and the range of acceptable answers. Cases can be assigned to interviewers at random, making it possible to measure interviewer variance. Groves (1989) argued that these features make centralised telephone surveys among the best settings for controlling interviewer error.
Telephone surveys also have disadvantages. Interviewer workloads are often large, so that each interviewer's effect is multiplied across many interviews. Respondents cannot see show cards, so all response options must be read aloud, which places more demands on memory and on the interviewer's reading. Rapport may be weaker, and respondents may be less willing to disclose sensitive information than in self-completion modes (Tourangeau & Smith, 1996; Kreuter et al., 2008). Nonresponse in telephone surveys has also become much more severe, increasing the importance of interviewers' persuasion skills (Lepkowski et al., 2008).
Reducing interviewer effects
Survey organisations use several approaches to reduce interviewer effects in telephone surveys.
Training
Training in standardised interviewing teaches interviewers to read questions as written, to use neutral probes and to avoid giving cues about expected answers. Fowler and Mangione (1990) found that interviewers with more training made fewer errors and produced smaller interviewer effects, although gains levelled off after a few days of training. Training should include practice with recorded feedback and specific guidance on the questions that are hardest to administer.
Monitoring and feedback
Centralised facilities allow supervisors to listen to a sample of interviews and code interviewer behaviour, for example whether questions were read exactly and whether probes were neutral. Behaviour coding of recorded interviews provides a systematic measure of interviewer performance (Cannell et al., 1981). Regular feedback based on monitoring helps interviewers maintain standards over the course of a survey, when experience can otherwise lead to shortcuts (Olson & Peytchev, 2007).
Question design
Because interviewer effects are larger for difficult questions, good question design reduces them. Clear questions with defined terms, simple response options and fully scripted probes leave less room for interviewers to improvise. Questions that interviewers find awkward to read, or that respondents often ask about, can be identified in pretesting and revised (Fowler & Mangione, 1990; Schaeffer et al., 2010).
Workload and assignment
Since variance inflation depends on the number of interviews per interviewer, spreading the work across more interviewers reduces the effect of each one. This must be balanced against the costs of recruiting and training more interviewers and the benefits of experience. Random assignment of cases to interviewers, where feasible, allows interviewer variance to be measured and taken into account in analysis.
Self-administered sections
For sensitive questions, interviewer influence can be removed by switching to self-administration. In telephone surveys, interactive voice response, in which respondents answer recorded questions using the telephone keypad, can be used for sensitive sections. Kreuter et al. (2008) found that both interactive voice response and web administration produced more reporting of sensitive information than telephone interviewing.
Standardised and conversational interviewing
An alternative to strict standardisation is conversational interviewing, in which interviewers are allowed to explain the meaning of questions and to help respondents map their circumstances onto the concepts being measured. Schober and Conrad (1997) found that conversational interviewing improved accuracy for questions about complicated circumstances, though interviews took longer. Conrad and Schober (2000) extended this finding to a national telephone survey.
Conversational interviewing raises a dilemma. It may reduce one source of error, misunderstanding of questions, while potentially increasing interviewer variance, because interviewers explain things in different ways. Its use is therefore best suited to factual questions with clear definitions, where the interviewer's explanation can be checked against the intended meaning, rather than to attitude questions, where any explanation may influence the answer.
Accounting for interviewers in analysis
Even with good training and monitoring, some interviewer variance remains. Analysts should take it into account when estimating standard errors. The simplest approach is to treat interviewers as clusters, in the same way that primary sampling units are treated in a cluster sample. Where interviewer identifiers are available, multilevel models can estimate interviewer variance directly and include interviewer characteristics, such as experience, as explanatory variables (Hox, 1994; West & Blom, 2017).
Many public-use data sets do not include interviewer identifiers, often for confidentiality reasons. Elliott and West (2015) argued that survey organisations should release interviewer identifiers, or at least provide guidance on interviewer clustering, so that analysts can estimate standard errors correctly. Davis et al. (2010) similarly recommended that public health surveys report interviewer effects routinely.
Interviewer identifiers also allow quality checks. Interviewers whose results differ markedly from their colleagues' can be identified for review. Unusual patterns, such as very short interviews, few "don't know" answers or identical response patterns, may indicate shortcuts or, in rare cases, falsification.
Interviewer effects in business and market research
Commercial telephone research often operates under tighter budgets and timetables than academic or official surveys. Interviewer teams may be smaller, workloads larger and training shorter, which can increase interviewer effects. Customer satisfaction surveys, in which respondents rate a company's service, are particularly exposed: respondents may give more positive ratings to an interviewer they believe works for the company, and interviewers may unintentionally encourage favourable answers. The same principles apply as in other surveys. Making clear that the interviewer works for an independent research organisation, monitoring calls and spreading work across interviewers all help. When results are compared across regions or time periods, analysts should check whether changes coincide with changes in the interviewing team.
An example
A research organisation runs a monthly telephone survey of 1,600 adults on household finances, using 20 interviewers who each complete about 80 interviews. The organisation assigns cases to interviewers at random within shifts and analyses interviewer variance each month.
For most factual questions, such as household size and employment status, ρ is close to zero. For a question asking respondents to rate how well they are managing financially, ρ is 0.02, implying that the variance of the estimate is about 2.6 times what it would be without interviewer effects. Listening to recorded calls, supervisors find that some interviewers read the response scale in full while others read only the end points after the first few questions. The organisation retrains interviewers, adds a reminder to the screen to read all options and increases the number of interviewers to 30. In the following quarter, ρ for the item falls to below 0.01, and the effective sample size for the rating increases substantially (illustrative example).
Conclusion
Interviewers are essential to telephone surveys, but they also introduce variation that is not visible in the data unless it is looked for. Interviewer variance increases the uncertainty of estimates, often more than researchers realise, because small differences between interviewers are multiplied across large workloads. Interviewer characteristics can bias answers on related topics, and differences in interviewers' persuasion skills can affect who responds. Standardised training, monitoring, careful question design, manageable workloads, self-administration for sensitive topics and appropriate analysis all reduce these effects. Treating interviewers as a measured part of the survey design, rather than a neutral channel, makes the knowledge produced by telephone surveys more accurate and more honest about its uncertainty.
References
Biemer, P. P., & Lyberg, L. E. (2003). Introduction to survey quality. Wiley. https://doi.org/10.1002/0471458740
Brunton-Smith, I., Sturgis, P., & Williams, J. (2012). Is success in obtaining contact and cooperation correlated with the magnitude of interviewer variance? Public Opinion Quarterly, 76(2), 265–286. https://doi.org/10.1093/poq/nfr067
Cannell, C. F., Miller, P. V., & Oksenberg, L. (1981). Research on interviewing techniques. Sociological Methodology, 12, 389–437. https://doi.org/10.2307/270748
Conrad, F. G., & Schober, M. F. (2000). Clarifying question meaning in a household telephone survey. Public Opinion Quarterly, 64(1), 1–28. https://doi.org/10.1086/316757
Cotter, P. R., Cohen, J., & Coulter, P. B. (1982). Race-of-interviewer effects in telephone interviews. Public Opinion Quarterly, 46(2), 278–284. https://doi.org/10.1086/268719
Davis, R. E., Couper, M. P., Janz, N. K., Caldwell, C. H., & Resnicow, K. (2010). Interviewer effects in public health surveys. Health Education Research, 25(1), 14–26. https://doi.org/10.1093/her/cyp046
Durrant, G. B., Groves, R. M., Staetsky, L., & Steele, F. (2010). Effects of interviewer attitudes and behaviors on refusal in household surveys. Public Opinion Quarterly, 74(1), 1–36. https://doi.org/10.1093/poq/nfp098
Elliott, M. R., & West, B. T. (2015). "Clustering by interviewer": A source of variance that is unaccounted for in single-stage health surveys. American Journal of Epidemiology, 182(2), 118–126. https://doi.org/10.1093/aje/kwv018
Finkel, S. E., Guterbock, T. M., & Borg, M. J. (1991). Race-of-interviewer effects in a preelection poll: Virginia 1989. Public Opinion Quarterly, 55(3), 313–330. https://doi.org/10.1086/269264
Fowler, F. J., Jr., & Mangione, T. W. (1990). Standardized survey interviewing: Minimizing interviewer-related error. SAGE.
Groves, R. M., & Magilavy, L. J. (1986). Measuring and explaining interviewer effects in centralized telephone surveys. Public Opinion Quarterly, 50(2), 251–266. https://doi.org/10.1086/268979
Groves, R. M. (1989). Survey errors and survey costs. Wiley. https://doi.org/10.1002/0471725277
Groves, R. M., Fowler, F. J., Jr., Couper, M. P., Lepkowski, J. M., Singer, E., & Tourangeau, R. (2009). Survey methodology (2nd ed.). Wiley.
Groves, R. M., O'Hare, B. C., Gould-Smith, D., Benki, J., & Maher, P. (2008). Telephone interviewer voice characteristics and the survey participation decision. In J. M. Lepkowski, C. Tucker, J. M. Brick, E. D. de Leeuw, L. Japec, P. J. Lavrakas, M. W. Link, & R. L. Sangster (Eds.), Advances in telephone survey methodology (pp. 385–400). Wiley.
Hox, J. J. (1994). Hierarchical regression models for interviewer and respondent effects. Sociological Methods & Research, 22(3), 300–318. https://doi.org/10.1177/0049124194022003002
Kane, E. W., & Macaulay, L. J. (1993). Interviewer gender and gender attitudes. Public Opinion Quarterly, 57(1), 1–28. https://doi.org/10.1086/269352
Kish, L. (1962). Studies of interviewer variance for attitudinal variables. Journal of the American Statistical Association, 57(297), 92–115. https://doi.org/10.1080/01621459.1962.10482153
Kreuter, F., Presser, S., & Tourangeau, R. (2008). Social desirability bias in CATI, IVR, and web surveys: The effects of mode and question sensitivity. Public Opinion Quarterly, 72(5), 847–865. https://doi.org/10.1093/poq/nfn063
Lepkowski, J. M., Tucker, C., Brick, J. M., de Leeuw, E. D., Japec, L., Lavrakas, P. J., Link, M. W., & Sangster, R. L. (Eds.). (2008). Advances in telephone survey methodology. Wiley. https://doi.org/10.1002/9780470173404
Mangione, T. W., Fowler, F. J., Jr., & Louis, T. A. (1992). Question characteristics and interviewer effects. Journal of Official Statistics, 8(3), 293–307.
Oksenberg, L., Coleman, L., & Cannell, C. F. (1986). Interviewers' voices and refusal rates in telephone surveys. Public Opinion Quarterly, 50(1), 97–111. https://doi.org/10.1086/268962
Olson, K., & Bilgen, I. (2011). The role of interviewer experience on acquiescence. Public Opinion Quarterly, 75(1), 99–114. https://doi.org/10.1093/poq/nfq067
Olson, K., & Peytchev, A. (2007). Effect of interviewer experience on interview pace and interviewer attitudes. Public Opinion Quarterly, 71(2), 273–286. https://doi.org/10.1093/poq/nfm007
O'Muircheartaigh, C., & Campanelli, P. (1998). The relative impact of interviewer effects and sample design effects on survey precision. Journal of the Royal Statistical Society: Series A (Statistics in Society), 161(1), 63–77. https://doi.org/10.1111/1467-985X.00090
Schaeffer, N. C., Dykema, J., & Maynard, D. W. (2010). Interviewers and interviewing. In P. V. Marsden & J. D. Wright (Eds.), Handbook of survey research (2nd ed., pp. 437–470). Emerald.
Schnell, R., & Kreuter, F. (2005). Separating interviewer and sampling-point effects. Journal of Official Statistics, 21(3), 389–410.
Schober, M. F., & Conrad, F. G. (1997). Does conversational interviewing reduce survey measurement error? Public Opinion Quarterly, 61(4), 576–602. https://doi.org/10.1086/297818
Tourangeau, R., & Smith, T. W. (1996). Asking sensitive questions: The impact of data collection mode, question format, and question context. Public Opinion Quarterly, 60(2), 275–304. https://doi.org/10.1086/297751
Tucker, C. (1983). Interviewer effects in telephone surveys. Public Opinion Quarterly, 47(1), 84–95. https://doi.org/10.1086/268768
West, B. T., & Blom, A. G. (2017). Explaining interviewer effects: A research synthesis. Journal of Survey Statistics and Methodology, 5(2), 175–211. https://doi.org/10.1093/jssam/smw024
West, B. T., & Olson, K. (2010). How much of interviewer variance is really nonresponse error variance? Public Opinion Quarterly, 74(5), 1004–1026. https://doi.org/10.1093/poq/nfq061