
Surveys · Nonresponse, weighting and data quality
Measurement Invariance Across Groups in Survey Research
Comparing survey scores between countries, age groups or other groups assumes that the questions measure the same thing in each group. This article explains measurement invariance, the levels at which it is tested and what researchers can do when it does not hold.
Much of the value of survey research comes from comparison. Researchers compare job satisfaction between countries, trust in institutions between age groups and customer loyalty between market segments. Every such comparison assumes that the questions measure the same concept, in the same way, in each group. If a set of questions means something different to younger and older people, or if respondents in one country use the response scale differently from those in another, then differences in scores may reflect differences in measurement rather than real differences between groups.
Measurement invariance, also called measurement equivalence, is the property that a measure works the same way across groups. Testing for it is now standard practice in cross-national and cross-cultural research and is increasingly common in other comparisons (Vandenberg & Lance, 2000; Davidov et al., 2014).
Why it matters
Consider a scale of five questions measuring trust in government. In one country, respondents may interpret "government" as the national government, in another as local officials. In one group, a question about whether officials "care about people like me" may be closely related to overall trust; in another, it may reflect views about a particular party. Response styles also differ: respondents in some cultures avoid extreme answers, while others agree readily with statements (Johnson et al., 2005; Baumgartner & Steenkamp, 2001). In each case, a comparison of average scores between groups mixes real differences in trust with differences in how the questions work.
Levels of invariance
Measurement invariance is usually tested with multiple-group confirmatory factor analysis, a statistical method that models how a set of items reflects one or more underlying concepts in each group. Invariance is tested in a sequence of increasingly strict levels, shown in Figure 1 (Meredith, 1993; Vandenberg & Lance, 2000).
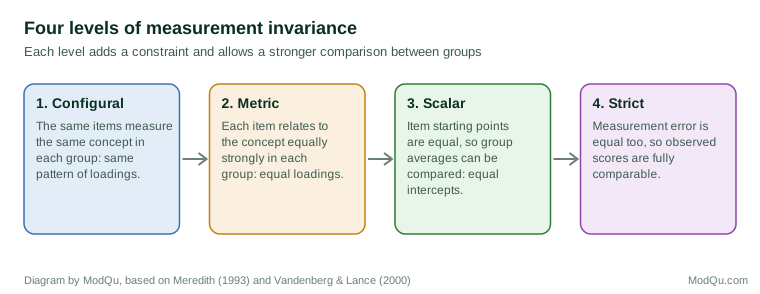
Configural invariance requires that the same items relate to the same concepts in each group. If one item belongs to a different concept in one group, the measures are not comparable at all.
Metric invariance requires that each item relates to the concept equally strongly in each group. Technically, the factor loadings are equal. Metric invariance allows comparison of relationships, such as correlations or regression coefficients, across groups.
Scalar invariance additionally requires that the item intercepts, the expected answers for people with the same level of the concept, are equal across groups. Only with scalar invariance can group averages be compared meaningfully (Steenkamp & Baumgartner, 1998).
Strict invariance also requires equal measurement error. It is rarely required for most comparisons and is often not tested.
Each level is tested by comparing the fit of a model with the added constraints to one without them. Because large samples make even trivial differences statistically significant, researchers usually judge invariance by changes in fit indices, such as the comparative fit index, rather than by significance tests alone (Cheung & Rensvold, 2002; Chen, 2007).
When invariance does not hold
Full scalar invariance is often not achieved, especially across many countries. Several responses are available (Putnick & Bornstein, 2016; van de Schoot et al., 2012):
- Partial invariance. If most items are invariant and only one or two differ, the constraints can be relaxed for those items. Comparisons of group means remain possible, provided that at least two items per concept are invariant.
- Restricting comparisons. If only metric invariance holds, researchers can compare relationships between variables across groups but should not compare average levels.
- Approximate methods. The alignment method estimates group means and loadings while allowing small, non-identical differences, which suits comparisons across many groups (Asparouhov & Muthén, 2014).
- Revising the measure. Items that function differently can be investigated, for example through cognitive interviews in each group, and rewritten or replaced in future surveys.
Related methods from item response theory test differential item functioning: whether people with the same level of a concept have different probabilities of giving a particular answer depending on their group (Holland & Wainer, 1993).
Designing for invariance
Testing for invariance after data collection shows whether comparisons are justified, but good design makes invariance more likely in the first place. In cross-national surveys, questions should be translated through a team process that includes independent translations, review and adjudication, rather than a single translation, so that meaning rather than wording is carried across languages. Concepts that vary in meaning between cultures, such as "family" or "household", need explicit definitions. Cognitive interviews and pretests in each group, not only in the group where the questionnaire was written, reveal items that are understood differently (Davidov et al., 2014).
Several features of question design also help. Item-specific response scales reduce reliance on agree–disagree formats, which are especially prone to differences in response style between groups. Using several items for each concept, rather than a single question, allows partial invariance to be tested and gives analysts room to drop a problem item while keeping the measure. Including some items whose meaning is expected to be very stable across groups, such as factual behaviours, provides anchors for comparison (Steenkamp & Baumgartner, 1998).
Beyond countries
Measurement invariance applies to any comparison: between men and women, age groups, education levels, survey modes and waves of a panel. Horn and McArdle (1992) emphasised its importance in studies of ageing, where changes in scores over time can reflect changes in how people interpret questions as well as real change. Testing invariance between modes is one way to examine mode effects in mixed-mode surveys.
An example
A company runs an employee engagement survey in eight countries using six agree–disagree items. Before comparing averages, the analysts test invariance. Configural and metric invariance hold, but scalar invariance does not: in two countries, respondents agree with one item, about recommending the company, much more readily than their answers to the other items would predict. Allowing that item's intercept to differ, partial scalar invariance holds. The analysts compare country averages using the partial model and note in the report that the recommendation item is not directly comparable across countries. The ranking of countries changes slightly compared with a simple comparison of raw averages (illustrative example).
Conclusion
Group comparisons in survey research are meaningful only if the questions measure the same concept in the same way in each group. Testing configural, metric and scalar invariance shows which comparisons are justified. When full invariance does not hold, partial invariance, restricted comparisons or approximate methods allow careful conclusions. Making invariance testing a routine step before comparing groups protects survey knowledge from differences that exist only in the measurement.
References
Asparouhov, T., & Muthén, B. (2014). Multiple-group factor analysis alignment. Structural Equation Modeling, 21(4), 495–508. https://doi.org/10.1080/10705511.2014.919210
Baumgartner, H., & Steenkamp, J.-B. E. M. (2001). Response styles in marketing research: A cross-national investigation. Journal of Marketing Research, 38(2), 143–156. https://doi.org/10.1509/jmkr.38.2.143.18840
Chen, F. F. (2007). Sensitivity of goodness of fit indexes to lack of measurement invariance. Structural Equation Modeling, 14(3), 464–504. https://doi.org/10.1080/10705510701301834
Cheung, G. W., & Rensvold, R. B. (2002). Evaluating goodness-of-fit indexes for testing measurement invariance. Structural Equation Modeling, 9(2), 233–255. https://doi.org/10.1207/S15328007SEM0902_5
Davidov, E., Meuleman, B., Cieciuch, J., Schmidt, P., & Billiet, J. (2014). Measurement equivalence in cross-national research. Annual Review of Sociology, 40, 55–75. https://doi.org/10.1146/annurev-soc-071913-043137
Holland, P. W., & Wainer, H. (Eds.). (1993). Differential item functioning. Lawrence Erlbaum Associates.
Horn, J. L., & McArdle, J. J. (1992). A practical and theoretical guide to measurement invariance in aging research. Experimental Aging Research, 18(3), 117–144. https://doi.org/10.1080/03610739208253916
Johnson, T., Kulesa, P., Cho, Y. I., & Shavitt, S. (2005). The relation between culture and response styles: Evidence from 19 countries. Journal of Cross-Cultural Psychology, 36(2), 264–277. https://doi.org/10.1177/0022022104272905
Meredith, W. (1993). Measurement invariance, factor analysis and factorial invariance. Psychometrika, 58(4), 525–543. https://doi.org/10.1007/BF02294825
Putnick, D. L., & Bornstein, M. H. (2016). Measurement invariance conventions and reporting: The state of the art and future directions for psychological research. Developmental Review, 41, 71–90. https://doi.org/10.1016/j.dr.2016.06.004
Steenkamp, J.-B. E. M., & Baumgartner, H. (1998). Assessing measurement invariance in cross-national consumer research. Journal of Consumer Research, 25(1), 78–90. https://doi.org/10.1086/209528
van de Schoot, R., Lugtig, P., & Hox, J. (2012). A checklist for testing measurement invariance. European Journal of Developmental Psychology, 9(4), 486–492. https://doi.org/10.1080/17405629.2012.686740
Vandenberg, R. J., & Lance, C. E. (2000). A review and synthesis of the measurement invariance literature: Suggestions, practices, and recommendations for organizational research. Organizational Research Methods, 3(1), 4–70. https://doi.org/10.1177/109442810031002