
Surveys · Nonresponse, weighting and data quality
The Use of Machine Learning for Predicting and Mitigating Survey Nonresponse
Machine learning methods such as classification trees and random forests can predict who is likely to respond to a survey. This article explains how these predictions are used to target fieldwork and to adjust for nonresponse, and what their limits are.
Surveys have long used statistical models to understand nonresponse. The usual tool is logistic regression, which estimates each sampled person's probability of responding from characteristics such as age, region or past participation. These response propensities are used to adjust weights and, increasingly, to direct fieldwork effort. Machine learning offers alternative methods that can find more complex patterns in the data, and survey researchers have begun to test how far these methods improve the prediction and mitigation of nonresponse (Buskirk et al., 2018; Kern et al., 2019).
What machine learning adds
Logistic regression requires the analyst to specify which variables and interactions enter the model. If response depends on a complicated combination of factors, such as young people in rented flats in large cities who were not contacted in the evening, the model will capture it only if the analyst anticipates it. Machine learning methods learn such patterns from the data.
Classification trees split the sample repeatedly into groups with different response rates, producing rules that are easy to interpret. Phipps and Toth (2012) used a regression tree with linked administrative data to identify groups of businesses with low response in an establishment survey. Random forests combine many trees built on random subsets of the data and variables, which usually gives more accurate and stable predictions (Breiman, 2001). Gradient boosting builds trees in sequence, each correcting the errors of the previous ones (Hastie et al., 2009).
Predicting nonresponse
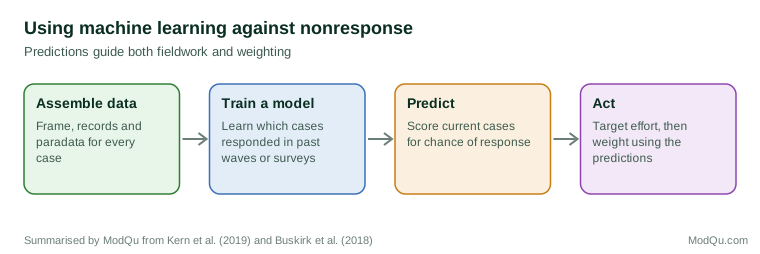
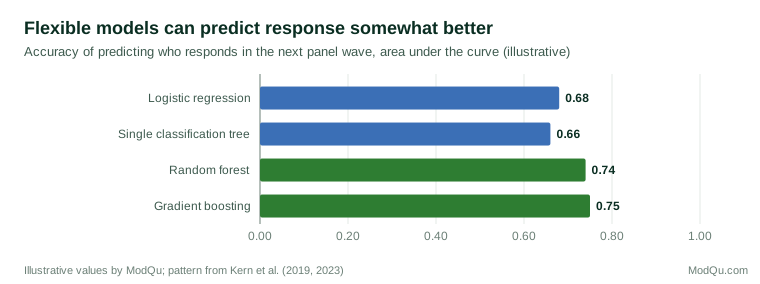
Panel surveys are a natural setting for machine learning, because rich information from earlier waves is available for every member. Kern et al. (2023) compared methods for predicting nonresponse in future waves of a German probability panel and found that tree-based ensembles predicted somewhat better than logistic regression, especially when paradata such as previous response times and breakoffs were included. Figure 1 shows how predictions are used, and Figure 2 illustrates typical differences in accuracy.
The data behind the predictions
The quality of any prediction depends on the information available for every sampled case, respondents and nonrespondents alike. Four sources are common. Sampling frame variables, such as region, type of address or business size, are available for all cases. Administrative records linked to the sample can add age, household composition or income band where the law and consent allow. Paradata, such as the number and timing of previous contact attempts, interviewer observations and, in web surveys, previous completion times and breakoffs, describe how each case has behaved during fieldwork (Kreuter, 2013). In panels, answers from earlier waves add a great deal, including reported interest in the survey topic and whether the member skipped questions. Machine learning methods are most useful when there are many such variables and their relationships with response are not well understood in advance.
Judging prediction accuracy
Prediction accuracy is commonly measured by the area under the curve (AUC), the probability that a randomly chosen respondent receives a higher predicted propensity than a randomly chosen nonrespondent. A value of 0.5 means the model does no better than chance; a value of 1 means perfect prediction. Accuracy must be measured on cases not used to fit the model, for example by cross-validation, in which the data are divided into parts and each part is predicted from a model fitted to the others (Hastie et al., 2009). For nonresponse adjustment, accuracy alone is not enough: the weights produced should also be checked for balance on auxiliary variables and for extreme values.
Mitigating nonresponse
Predictions can be used in two ways.
During fieldwork, they identify cases at high risk of not responding, so that these cases can receive additional effort, a different mode or a larger incentive. This is the basis of many adaptive survey designs (Schouten et al., 2017). In panels, members predicted to drop out can be contacted earlier or offered a more convenient mode before they are lost.
After fieldwork, predicted propensities are used to construct nonresponse weights. Lee et al. (2010) found in simulations that propensity weights estimated with boosting and random forests often gave less biased estimates than those from logistic regression when the true relationship was complex. McCaffrey et al. (2004) had earlier shown the value of boosted models for estimating propensity scores. Buskirk and Kolenikov (2015) compared random forests and logistic regression for response propensity weighting and found that forests could produce good balance but sometimes extreme weights, which increase variance.
Limits
Machine learning does not solve the fundamental problem of nonresponse. Predictions can only use variables available for both respondents and nonrespondents. If these variables are only weakly related to the survey's key outcomes, better prediction of response will not reduce bias in those outcomes (Kern et al., 2019). Complex models can also overfit, fitting noise in one survey that does not repeat in the next, so predictions must be tested on data not used to build the model. Finally, some methods are hard to interpret, which can make it difficult to explain why particular cases received different treatment. Survey organisations should document the variables used, check that predictions do not simply reproduce sensitive characteristics, and keep a simple model alongside the complex one as a benchmark.
An example
A panel company uses a random forest, trained on five years of panel data, to predict which members will miss the next wave. Members in the highest-risk tenth receive a reminder by text message and a small additional incentive. Retention in that group improves by six percentage points compared with a randomly held-out control group, at a cost lower than recruiting replacements (illustrative example).
Conclusion
Machine learning methods can predict survey nonresponse somewhat more accurately than traditional models, especially when rich data from past waves and paradata are available. The predictions are useful for targeting fieldwork and for constructing weights. Their value depends, however, on the auxiliary data available, and better prediction of response does not guarantee less biased estimates. Used with careful validation and alongside established methods, machine learning is a useful addition to the survey researcher's tools.
References
Breiman, L. (2001). Random forests. Machine Learning, 45(1), 5–32. https://doi.org/10.1023/A:1010933404324
Buskirk, T. D., & Kolenikov, S. (2015). Finding respondents in the forest: A comparison of logistic regression and random forest models for response propensity weighting and stratification. Survey Methods: Insights from the Field. https://doi.org/10.13094/SMIF-2015-00003
Buskirk, T. D., Kirchner, A., Eck, A., & Signorino, C. S. (2018). An introduction to machine learning methods for survey researchers. Survey Practice, 11(1). https://doi.org/10.29115/SP-2018-0004
Hastie, T., Tibshirani, R., & Friedman, J. (2009). The elements of statistical learning: Data mining, inference, and prediction (2nd ed.). Springer. https://doi.org/10.1007/978-0-387-84858-7
Kern, C., Klausch, T., & Kreuter, F. (2019). Tree-based machine learning methods for survey research. Survey Research Methods, 13(1), 73–93. https://doi.org/10.18148/srm/2019.v13i1.7395
Kern, C., Weiß, B., & Kolb, J.-P. (2023). Predicting nonresponse in future waves of a probability-based mixed-mode panel with machine learning. Journal of Survey Statistics and Methodology, 11(1), 100–123. https://doi.org/10.1093/jssam/smab009
Kreuter, F. (Ed.). (2013). Improving surveys with paradata: Analytic uses of process information. Wiley. https://doi.org/10.1002/9781118596869
Lee, B. K., Lessler, J., & Stuart, E. A. (2010). Improving propensity score weighting using machine learning. Statistics in Medicine, 29(3), 337–346. https://doi.org/10.1002/sim.3782
McCaffrey, D. F., Ridgeway, G., & Morral, A. R. (2004). Propensity score estimation with boosted regression for evaluating causal effects in observational studies. Psychological Methods, 9(4), 403–425. https://doi.org/10.1037/1082-989X.9.4.403
Phipps, P., & Toth, D. (2012). Analyzing establishment nonresponse using an interpretable regression tree model with linked administrative data. Annals of Applied Statistics, 6(2), 772–794. https://doi.org/10.1214/11-AOAS521
Schouten, B., Peytchev, A., & Wagner, J. (2017). Adaptive survey design. CRC Press. https://doi.org/10.1201/9781315153964