
Surveys · Nonresponse, weighting and data quality
Establishment of Survey Quality Indicators Beyond Traditional Response Rates
The response rate has long been the headline measure of survey quality, but it says little about bias. This article explains the indicators that survey researchers now use alongside it, including representativeness indicators, benchmark comparisons, data quality measures and weighting efficiency.
For decades, the response rate was the main number used to judge a survey. A high rate signalled a careful survey; a low rate signalled a weak one. Funders set minimum rates, journals asked for them and clients compared suppliers on them. The response rate remains important, but research over the past twenty-five years has shown that it is a poor guide to the quality of survey estimates. Surveys with low response rates can produce accurate results, and surveys with high rates can be biased (Groves, 2006; Groves & Peytcheva, 2008).
This article explains why the response rate is not enough and describes the indicators that survey researchers now use alongside it. These indicators help researchers, clients and users judge how much confidence to place in survey findings.
Why the response rate is not enough
The response rate measures the share of eligible sampled cases that respond. Nonresponse bias in an estimate, however, depends on two things: how many people do not respond and how different they are from those who do. A low response rate produces large bias only if response is related to the variable being measured.
Several well-known studies illustrate this. Keeter et al. (2000) compared a standard five-day telephone survey with a more rigorous survey that achieved a much higher response rate through extended fieldwork. Across many measures, the results were very similar. Curtin et al. (2000) found that removing the cases that required the most effort to obtain, which reduced the response rate substantially, had little effect on the index of consumer sentiment. Keeter et al. (2006) repeated the comparison with similar results.
Groves (2006) and Groves and Peytcheva (2008) brought the evidence together in a meta-analysis of studies in which nonresponse bias could be measured directly. They found large differences in bias between estimates within the same survey, and only a weak relationship between a survey's response rate and the bias of its estimates. The response rate predicted bias poorly because bias varies from one variable to another, depending on whether that variable is related to the reasons people do or do not respond.
The response rate has other limitations. It treats all respondents as equally valuable, although some groups may already be well represented. It can be increased by efforts that bring in more of the same kind of respondent without reducing bias (Peytchev et al., 2009). It says nothing about the quality of the answers that respondents give. And in surveys that use nonprobability samples or opt-in panels, response rates in the traditional sense cannot be calculated at all.
A wider view of quality
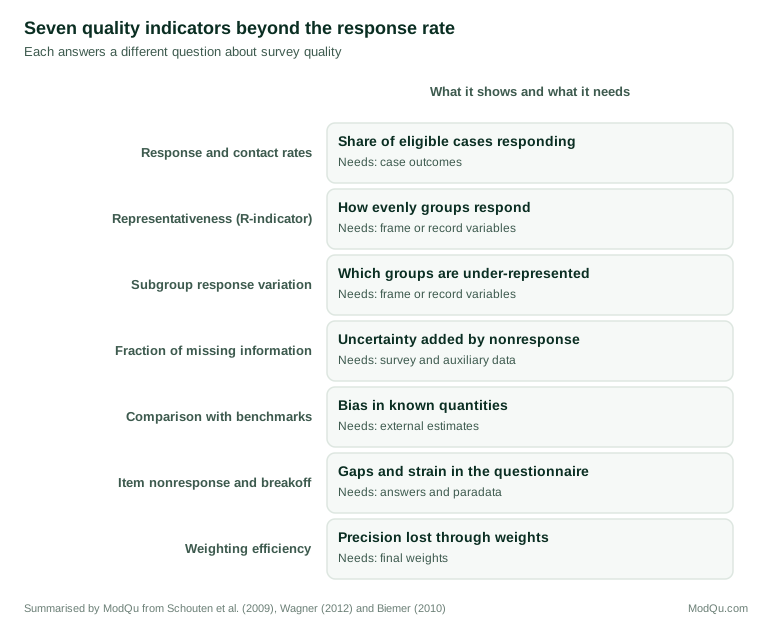
Survey methodologists now judge quality within the total survey error framework, which considers all the ways in which a survey estimate can differ from the true value: coverage, sampling, nonresponse, measurement and processing errors (Biemer, 2010; Groves & Lyberg, 2010). Statistical agencies also use broader quality frameworks that include relevance, timeliness, accessibility and coherence alongside accuracy (Statistics Canada, 2019). Within this wider view, the response rate is one indicator among many. Figure 1 summarises seven indicators that are commonly used alongside it.
Outcome rates, properly defined
The first step beyond a single response rate is to report the full set of outcome rates: contact, cooperation, refusal and response rates, calculated using standard definitions. The American Association for Public Opinion Research (2023) publishes standard definitions that specify how each sampled case should be classified and how each rate is calculated, including how cases of unknown eligibility are treated. Reporting the full set shows whether nonresponse arose mainly from failure to contact people or from refusals, which have different implications for bias and for remedies.
Representativeness indicators
If bias depends on whether response is related to people's characteristics, then a useful indicator should measure how far response varies across groups. Representativeness indicators, or R-indicators, do this (Schouten et al., 2009). Using variables known for every sampled case, such as age, sex, region or type of household from the sampling frame or administrative records, a model estimates each case's probability of responding. The R-indicator is based on the variation of these estimated propensities: if every group responds at the same rate, the variation is zero and the indicator takes its maximum value of 1. The more response varies between groups, the lower the indicator.
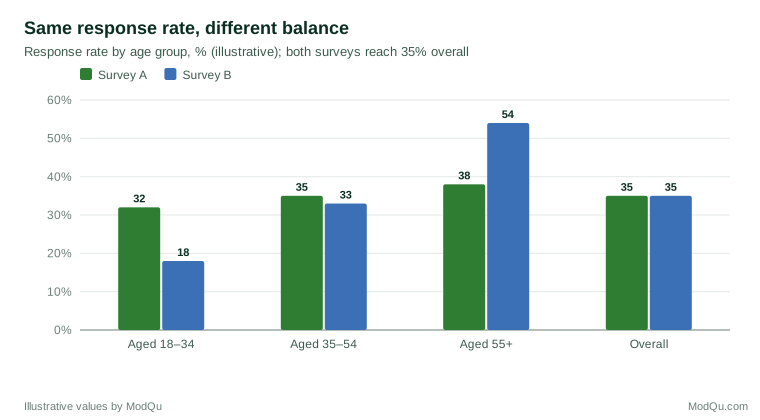
Two surveys with the same response rate can have very different R-indicators. Figure 2 shows an illustration: both surveys reach 35 per cent overall, but in Survey B, young people respond at a third of the rate of older people.
Partial R-indicators show which variables and which categories contribute most to the lack of balance, so that fieldwork effort can be directed to the groups that are under-represented (Schouten et al., 2011). These indicators are used in adaptive survey designs, where fieldwork is adjusted during data collection to improve balance.
A simpler related measure is the coefficient of variation of subgroup response rates, which summarises how much response rates differ across groups. Särndal and Lundström (2010) proposed related measures of the distance between respondents and the full sample on auxiliary variables, which can guide both fieldwork and the choice of variables for weighting.
R-indicators have limitations. They measure balance only on the variables included in the model, and a survey may be well balanced on age and region but still biased on the variables it is designed to measure. Their value also depends on the number and quality of the auxiliary variables available (Moore et al., 2018).
Indicators of the risk of nonresponse bias
Other indicators try to measure the risk of bias in the survey's key estimates more directly.
The fraction of missing information draws on multiple imputation. Nonrespondents' values on key variables are imputed many times using auxiliary data, and the indicator measures how much uncertainty the imputations add relative to the total. A high fraction means that nonresponse leaves much uncertainty about the estimate; a low fraction means that the auxiliary data predict the missing values well (Wagner, 2010).
Wagner (2012) compared several indicators of the risk of nonresponse bias and classified them by whether they use only auxiliary data, only survey data, or both. Indicators that use both the survey variables and auxiliary data, such as the correlation between response propensities and key outcomes among respondents, are more informative about specific estimates but harder to calculate. Nishimura et al. (2016) compared alternative indicators in simulations and found that no single indicator worked well in all conditions, which supports reporting several.
Proxy pattern-mixture analysis takes a related approach, estimating how much estimates would change under different assumptions about how nonrespondents differ from respondents, using a proxy variable built from auxiliary data (Andridge & Little, 2011). It gives a range of plausible estimates rather than a single number.
Comparisons with benchmarks
When reliable external estimates exist for some of the variables a survey measures, comparing the survey with these benchmarks gives a direct check on accuracy. Typical benchmarks include population censuses, large official surveys with high response rates and administrative records, such as the number of people receiving a benefit or holding a driving licence. Differences between the survey and the benchmarks, after weighting, show how far the survey departs from known values.
Benchmark comparisons have limitations. Benchmarks exist only for some variables, often demographic ones that are also used in weighting, so that a survey will agree with them by construction. Variables not used in weighting, such as voting, smoking or volunteering, provide a more useful test. Differences in question wording and definitions between the survey and the benchmark must also be considered.
Comparisons within the survey
Several indicators use variation within a survey. Comparing early and late respondents assumes that people who respond only after many attempts resemble nonrespondents; if late respondents differ from early ones on key variables, nonresponse bias is likely. Comparing estimates before and after weighting shows how much the weights change the results; large changes suggest that the unweighted respondents differed substantially from the population. Nonresponse follow-up studies, in which a subsample of nonrespondents is pursued with intensive effort, provide direct information about those who did not respond initially (Groves, 2006).
Data quality indicators
Quality depends on what respondents say as well as on who responds. Several indicators measure the quality of answers:
- Item nonresponse rates show how often respondents skip questions or answer "don't know". High rates on particular questions point to problems of sensitivity, difficulty or design.
- Breakoff rates show how many respondents start but do not finish the questionnaire, and where they stop.
- Straightlining, giving the same answer to every item in a grid, and speeding, answering faster than is plausible, indicate low effort.
- Inconsistencies between related answers can reveal misunderstanding or careless responding.
- Interviewer variance, in interviewer-administered surveys, shows how much answers depend on which interviewer asked the questions.
Many of these indicators can be calculated from paradata, the data collected as a by-product of fieldwork, such as response times and call records (Kreuter, 2013). Reporting them allows users to judge whether answers were given with adequate care.
Precision and weighting efficiency
Weighting adjusts for differences between respondents and the population, but variable weights increase the variance of estimates. The design effect due to weighting, often approximated by Kish's formula 1 + CV², where CV is the coefficient of variation of the weights, measures this loss of precision (Kish, 1992). The effective sample size, the actual sample size divided by the design effect, shows how many respondents the survey is worth after weighting. A survey of 2,000 respondents with a weighting design effect of 2 has the precision of a simple random sample of 1,000.
Large design effects due to weighting indicate that the achieved sample differed substantially from the population and that heavy adjustment was needed. Weighting can reduce bias but only at a cost in precision, and when the variables used for weighting are only weakly related to the survey outcomes, the cost may outweigh the benefit (Little & Vartivarian, 2005).
Coverage and frame quality
Nonresponse is not the only source of error before data collection begins. Coverage indicators show how well the sampling frame represents the target population: what share of the population is missing from the frame, which groups are most affected and whether the frame contains duplicates or ineligible units. For telephone samples, coverage depends on the mix of mobile and landline numbers; for address-based samples, on the completeness of the address list; and for online panels, on internet access and on who chose to join. Coverage problems cannot be fixed by raising the response rate, so they need indicators of their own (Biemer, 2010).
Indicators for nonprobability samples
Many surveys now use opt-in online panels and other nonprobability samples, for which response rates have little meaning. For such samples, quality indicators focus on how the sample was assembled and on how well it matches the population after adjustment. Useful indicators include the participation rate among panel members invited, comparisons with benchmarks on variables not used in weighting, the design effect due to weighting and the data quality indicators described above. Reporting these indicators allows comparisons between probability and nonprobability surveys on a common basis (Brick, 2013).
Indicators of measurement quality
Most of the indicators above concern who responds. Measurement quality, whether respondents' answers are accurate, needs indicators of its own. Where survey answers can be linked to records, such as administrative data on benefits or hospital stays, the agreement between answers and records gives a direct measure of measurement error. Where the same question is asked twice, in a reinterview or in different waves of a panel, the consistency of answers indicates reliability. In interviewer-administered surveys, the intra-interviewer correlation shows how much answers depend on who asked the questions; a research synthesis by West and Blom (2017) found that such effects are common and are larger for attitudinal and sensitive questions. Reporting these indicators, even for a few key variables, shows users that measurement has been examined as well as response.
Reporting indicators to users
Indicators are useful only if they reach the people who use the results. Methodological reports and technical appendices should present the quality profile in a consistent format from one survey round to the next, so that changes can be seen. For non-specialist readers, a short summary that explains in plain language what the indicators show, and what they do not, is more useful than a table of numbers. Reporting should be honest about limitations: a statement that estimates for a small group are based on few respondents, or that one benchmark comparison showed a large difference, helps users more than a single headline rate.
Building a quality profile
No single indicator captures survey quality. Survey organisations increasingly report a quality profile: a set of indicators that together describe coverage, response, representativeness, data quality and precision. A practical profile might include:
- The full set of outcome rates, using standard definitions.
- Response rates by key subgroups and an R-indicator or coefficient of variation.
- Comparisons with benchmarks on at least some variables not used in weighting.
- Item nonresponse and breakoff rates for key questions.
- Indicators of low-effort responding, such as straightlining and speeding.
- The design effect due to weighting and the effective sample size.
- A description of how the sample was drawn and weighted.
Statistical agencies have published quality guidelines that set out similar requirements for official statistics (Statistics Canada, 2019). For commercial and academic surveys, such a profile gives clients and readers the information they need to judge how much weight to place on the results.
Using indicators during fieldwork
Many of these indicators can be calculated during data collection as well as afterwards. Monitoring R-indicators, subgroup response rates and key estimates as fieldwork progresses shows whether additional effort is improving balance or merely adding cases similar to those already obtained (Peytchev et al., 2009). This information supports responsive and adaptive designs, in which fieldwork strategies are changed to target under-represented groups. It also helps decide when to stop: once additional effort no longer changes estimates or improves balance, further spending may not be justified.
An example
A research company runs an annual survey of small business owners. In the latest year, the response rate falls from 28 to 22 per cent, and the client asks whether the results can still be trusted. The company prepares a quality profile. Response rates by business size and region show that the fall was concentrated among the smallest businesses, and the R-indicator declined from 0.86 to 0.79. Comparisons with official business counts by sector, which were not used in weighting, show differences of under two percentage points. The design effect due to weighting rose from 1.4 to 1.7, reducing the effective sample size. Item nonresponse and straightlining are unchanged.
The company concludes that the survey remains usable but that estimates for the smallest businesses are less precise and possibly less reliable. It adds a mailed reminder targeted at small businesses for the next year and reports the quality profile alongside the findings (illustrative example).
Conclusion
The response rate is easy to calculate and easy to compare, but it predicts bias poorly and says nothing about measurement, coverage or precision. A modern assessment of survey quality uses a set of indicators: standard outcome rates, representativeness indicators, indicators of the risk of nonresponse bias, benchmark comparisons, data quality measures and weighting efficiency. Together they give a fuller and more honest picture of how far survey results can be trusted. Establishing such indicators as routine practice, and reporting them alongside findings, strengthens the knowledge that surveys generate.
References
American Association for Public Opinion Research. (2023). Standard definitions: Final dispositions of case codes and outcome rates for surveys (10th ed.). AAPOR. https://aapor.org/standards-and-ethics/standard-definitions/
Andridge, R. R., & Little, R. J. A. (2011). Proxy pattern-mixture analysis for survey nonresponse. Journal of Official Statistics, 27(2), 153–180.
Biemer, P. P. (2010). Total survey error: Design, implementation, and evaluation. Public Opinion Quarterly, 74(5), 817–848. https://doi.org/10.1093/poq/nfq058
Brick, J. M. (2013). Unit nonresponse and weighting adjustments: A critical review. Journal of Official Statistics, 29(3), 329–353. https://doi.org/10.2478/jos-2013-0026
Curtin, R., Presser, S., & Singer, E. (2000). The effects of response rate changes on the index of consumer sentiment. Public Opinion Quarterly, 64(4), 413–428. https://doi.org/10.1086/318638
Groves, R. M., & Lyberg, L. (2010). Total survey error: Past, present, and future. Public Opinion Quarterly, 74(5), 849–879. https://doi.org/10.1093/poq/nfq065
Groves, R. M., & Peytcheva, E. (2008). The impact of nonresponse rates on nonresponse bias: A meta-analysis. Public Opinion Quarterly, 72(2), 167–189. https://doi.org/10.1093/poq/nfn011
Groves, R. M. (2006). Nonresponse rates and nonresponse bias in household surveys. Public Opinion Quarterly, 70(5), 646–675. https://doi.org/10.1093/poq/nfl033
Keeter, S., Kennedy, C., Dimock, M., Best, J., & Craighill, P. (2006). Gauging the impact of growing nonresponse on estimates from a national RDD telephone survey. Public Opinion Quarterly, 70(5), 759–779. https://doi.org/10.1093/poq/nfl035
Keeter, S., Miller, C., Kohut, A., Groves, R. M., & Presser, S. (2000). Consequences of reducing nonresponse in a national telephone survey. Public Opinion Quarterly, 64(2), 125–148. https://doi.org/10.1086/317759
Kish, L. (1992). Weighting for unequal P<sub>i</sub>. Journal of Official Statistics, 8(2), 183–200.
Kreuter, F. (Ed.). (2013). Improving surveys with paradata: Analytic uses of process information. Wiley. https://doi.org/10.1002/9781118596869
Little, R. J., & Vartivarian, S. (2005). Does weighting for nonresponse increase the variance of survey means? Survey Methodology, 31(2), 161–168.
Moore, J. C., Durrant, G. B., & Smith, P. W. F. (2018). Data set representativeness during data collection in three UK social surveys: Generalizability and the effects of auxiliary covariate choice. Journal of the Royal Statistical Society: Series A, 181(1), 229–248. https://doi.org/10.1111/rssa.12256
Nishimura, R., Wagner, J., & Elliott, M. (2016). Alternative indicators for the risk of non-response bias: A simulation study. International Statistical Review, 84(1), 43–62. https://doi.org/10.1111/insr.12100
Peytchev, A., Baxter, R. K., & Carley-Baxter, L. R. (2009). Not all survey effort is equal: Reduction of nonresponse bias and nonresponse error. Public Opinion Quarterly, 73(4), 785–806. https://doi.org/10.1093/poq/nfp037
Schouten, B., Cobben, F., & Bethlehem, J. (2009). Indicators for the representativeness of survey response. Survey Methodology, 35(1), 101–113.
Schouten, B., Shlomo, N., & Skinner, C. (2011). Indicators for monitoring and improving representativeness of response. Journal of Official Statistics, 27(2), 231–253.
Särndal, C.-E., & Lundström, S. (2010). Design for estimation: Identifying auxiliary vectors to reduce nonresponse bias. Survey Methodology, 36(2), 131–144.
Statistics Canada. (2019). Statistics Canada quality guidelines (6th ed., Catalogue no. 12-539-X). https://www150.statcan.gc.ca/n1/en/catalogue/12-539-X
Wagner, J. (2010). The fraction of missing information as a tool for monitoring the quality of survey data. Public Opinion Quarterly, 74(2), 223–243. https://doi.org/10.1093/poq/nfq007
Wagner, J. (2012). A comparison of alternative indicators for the risk of nonresponse bias. Public Opinion Quarterly, 76(3), 555–575. https://doi.org/10.1093/poq/nfs032
West, B. T., & Blom, A. G. (2017). Explaining interviewer effects: A research synthesis. Journal of Survey Statistics and Methodology, 5(2), 175–211. https://doi.org/10.1093/jssam/smw024