
Surveys · Questionnaire design
The Middle Option Debate: Should Scales Include a Neutral Point?
Offering a neutral middle option on a rating scale changes how many people choose it and can change what the results mean. This article reviews the evidence on middle options, explains why respondents choose them and gives practical guidance on when to include one.
Should a rating scale have a middle point? A five-point agreement scale includes "neither agree nor disagree"; a four-point scale does not. A question asking whether people favour or oppose a policy can offer a third option such as "neither" or "it depends," or it can leave respondents to choose a side. These choices look like small details, but they change the answers people give. Offering a middle option can move a fifth or more of respondents away from the two sides, and it can change what the remaining answers mean.
The debate over middle options is one of the longest-running in questionnaire design. One side argues that a neutral point is needed because some people genuinely hold neutral views, and forcing them to choose a side creates false opinions. The other side argues that a middle option gives respondents an easy way out, so that people who lean one way, or who have not thought about the question, choose the middle rather than doing the work of answering. Both arguments are supported by evidence. This article reviews that evidence and turns it into practical guidance.
What happens when a middle option is offered
The classic experiments were carried out by Stanley Presser and Howard Schuman, who randomly assigned respondents in national surveys to versions of the same question with and without an explicit middle alternative (Presser & Schuman, 1980; Schuman & Presser, 1981). For example, respondents were asked whether laws on divorce should be made easier, made more difficult or left as they are, with the third option either read out or not.
Three findings emerged. First, offering the middle option substantially increased the number of respondents choosing it, typically by between 10 and 20 percentage points. When it was not offered, some respondents still volunteered it, but far fewer. Second, the people drawn to the middle option came from both sides, roughly in proportion to their size, so the ratio of support to opposition among those who chose a side changed little. Third, the people most likely to move to the middle when it was offered tended to be those with less intense views on the issue.
Graham Kalton and colleagues found a similar pattern in British experiments (Kalton et al., 1980). George Bishop later showed that the effect was larger when the middle option was mentioned explicitly in the body of the question, rather than only appearing in the list of answers (Bishop, 1987).
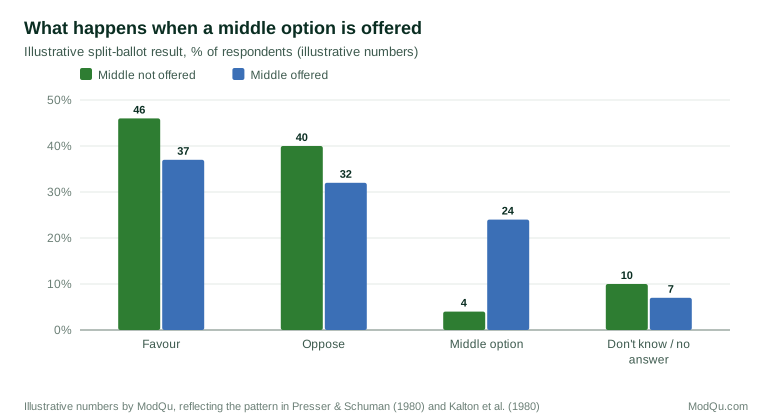
The second finding is reassuring for some purposes. If the main interest is in the balance of opinion among those with a view, including or excluding the middle option may not change the conclusion. But the size of each side does change, and so does the share of the population described as having an opinion. A headline such as "46% support the policy" becomes "37% support the policy" when the middle option is added, as Figure 1 illustrates with illustrative numbers. Neither figure is wrong, but they are not comparable.
Why respondents choose the middle
The central question is what a middle answer means. Research has identified several different reasons for choosing it.
Genuine neutrality
Some respondents hold a considered view that lies between the two sides. They see merits in both, or they think the status quo is right. For these respondents, a middle option is the only accurate answer, and removing it forces them to misreport their view.
Ambivalence
Others hold strong but conflicting feelings: they may like a product's design and dislike its price. A middle point records the net result, but it cannot distinguish ambivalence from indifference. Studies of how respondents interpret the midpoint of agreement scales have found that some use it to mean "it depends" or "partly agree and partly disagree," rather than to express a neutral view (Kulas et al., 2008; Nadler et al., 2015).
No opinion
A third group has no opinion at all, either because they know nothing about the topic or because they have never thought about it. Philip Converse's work on public opinion showed that many survey answers on unfamiliar issues are close to random, because respondents feel obliged to answer even when they have no view (Converse, 1964). Some of these respondents choose the middle option as a polite way of saying "don't know." Patrick Sturgis and colleagues tested this directly by following up middle responses with a probe asking what respondents had meant. A substantial proportion of those who chose "neither agree nor disagree" said, when asked, that they did not have an opinion or did not know enough to answer (Sturgis et al., 2014). Similar findings have been reported among adolescents, who often used the midpoint when they did not understand an item or had no view on it (Raaijmakers et al., 2000).
Item difficulty plays a part as well. When survey items are harder to read, respondents are more likely to choose the midpoint, which suggests that some midpoint responses reflect confusion rather than neutrality (Velez & Ashworth, 2007).
Satisficing
The fourth reason is effort. Jon Krosnick has argued that when respondents lack the ability or motivation to answer carefully, they look for an answer that is acceptable without much thought, a behaviour he called satisficing (Krosnick, 1991). The middle option is an obvious candidate: it seems reasonable, commits the respondent to nothing and does not require them to decide which way they lean. On this view, offering a middle option invites some respondents to give a lower-quality answer than they otherwise would.
Does the middle option improve or harm data quality?
If the middle option attracts mainly genuinely neutral respondents, it should improve measurement. If it attracts mainly satisficers and people without opinions, it should harm it. The evidence suggests that both happen, and that the balance depends on the topic, the population and the design of the question.
Studies of reliability and validity give mixed results. Alwin and Krosnick examined how features of attitude questions, including the number of response options and the presence of a middle option, related to reliability across many survey items and found that the effects of a midpoint were not consistent (Alwin & Krosnick, 1991). Reviews of rating scale design generally conclude that scales with a midpoint can work well, and that bipolar scales, which run from one pole through a neutral point to the opposite pole, are usually better with a midpoint than without (Krosnick & Fabrigar, 1997; Krosnick & Presser, 2010). The midpoint also affects response styles: in marketing research, including a midpoint has been found to change the tendency of respondents to choose extreme answers or to agree regardless of content (Weijters et al., 2010).
An early review of scale length reached a similar practical conclusion: whether to include a midpoint should depend on whether neutrality is a meaningful position for the issue being measured (Cox, 1980). Where it is, leaving it out forces some respondents to pick a side they do not hold.
Practical guidance
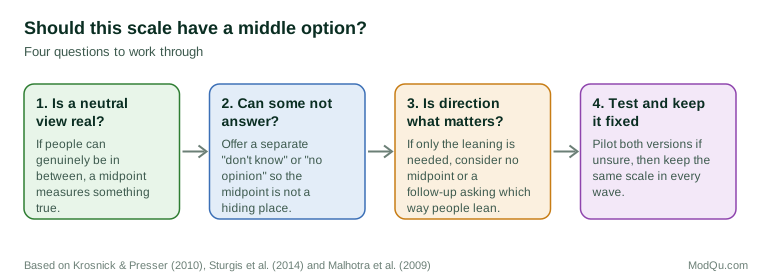
The evidence does not support a single rule for every question. It does support the following practical guidance.
Include a midpoint when neutrality is a real position
For bipolar scales, such as satisfied to dissatisfied or favour to oppose, a neutral position is often genuine. A customer can be neither satisfied nor dissatisfied with a routine transaction. Removing the midpoint in such cases forces those respondents to pick a side, which adds noise and may bias the results in whichever direction respondents lean when pushed. In most such cases, a five- or seven-point scale with a labelled midpoint is a sound default (Krosnick & Presser, 2010; Saris & Gallhofer, 2014).
Separate "no opinion" from neutrality
Many of the problems with the middle option arise because it serves as a substitute for "don't know." When some respondents may genuinely lack an opinion or the knowledge to answer, a separate "don't know" or "no opinion" option, visually distinct from the scale, lets them say so without contaminating the midpoint (Sturgis et al., 2014). In web surveys, the non-substantive option should be set apart from the scale with extra space or a dividing line, because respondents tend to treat the visual centre of a set of options as the conceptual midpoint (Tourangeau et al., 2004).
Consider leaving it out when direction is what matters
Where the purpose is to establish which way people lean, and genuine neutrality is unlikely or unimportant, a scale without a midpoint may be appropriate. An alternative that keeps the advantages of both approaches is a branching format: ask first whether the respondent favours, opposes or is neither, then ask those who chose "neither" whether they lean one way or the other, and ask those who chose a side how strongly they hold it. Experiments have found that well-designed branching questions can improve the validity of measurement of bipolar attitudes (Malhotra et al., 2009).
Do not hide the middle option in the question
If a middle option is offered, it should be offered consistently, either in the question text and the answer list or only in the answer list. The way the option is presented changes how often it is chosen (Bishop, 1987). In telephone interviews, where respondents hear the options, a middle option that is listed but not read aloud will be chosen much less often than one that is read.
Keep the scale fixed over time
Whatever choice is made, it should be kept constant in repeated surveys. Adding or removing a middle option between waves will produce an apparent change in opinion that is entirely due to the question. This is one of the commonest causes of misleading trends in business trackers.
Test when in doubt
When the choice matters and the evidence for the specific topic is unclear, a split-ballot experiment, in which random halves of a pilot sample receive the two versions, shows how much difference the middle option makes and who chooses it (Schuman & Presser, 1981). Follow-up probes asking what respondents meant by a middle answer are an inexpensive way to find out whether the midpoint is measuring neutrality, ambivalence or no opinion.
Implications for business research
In customer and employee surveys, the middle option often decides whether a result looks good or bad. A satisfaction score reported as the percentage "satisfied" falls when a neutral option is added, because some previously satisfied respondents move to the middle. A net score calculated as the percentage positive minus the percentage negative may change less, since both sides tend to shrink in proportion. Reports should therefore state which scale was used and avoid comparing results across scales with and without a midpoint.
In product and concept testing, a large share of neutral answers is itself informative. It may mean that respondents do not understand the concept, do not care about it or see no difference between options. Asking those who choose the middle a short follow-up question, such as what would make them more positive, often yields more useful information than forcing them to choose a side.
Conclusion
A middle option on a rating scale changes the results. When it is offered, many more respondents choose it, mostly people with weaker views drawn from both sides. Some of them are genuinely neutral, some ambivalent, some without any opinion and some simply looking for an easy answer. Whether a midpoint improves or harms measurement depends on which of these groups dominates for a given question and population. The best practice is to include a midpoint when neutrality is a meaningful position, to offer a separate way of saying "don't know," to consider branching formats when direction matters and to keep the scale constant over time (Payne, 1951; Dillman et al., 2014).
References
Alwin, D. F., & Krosnick, J. A. (1991). The reliability of survey attitude measurement: The influence of question and respondent attributes. Sociological Methods & Research, 20(1), 139–181. https://doi.org/10.1177/0049124191020001005
Bishop, G. F. (1987). Experiments with the middle response alternative in survey questions. Public Opinion Quarterly, 51(2), 220–232. https://doi.org/10.1086/269030
Converse, P. E. (1964). The nature of belief systems in mass publics. In D. E. Apter (Ed.), Ideology and discontent (pp. 206–261). Free Press.
Cox, E. P., III. (1980). The optimal number of response alternatives for a scale: A review. Journal of Marketing Research, 17(4), 407–422. https://doi.org/10.1177/002224378001700401
Dillman, D. A., Smyth, J. D., & Christian, L. M. (2014). Internet, phone, mail, and mixed-mode surveys: The tailored design method (4th ed.). Wiley.
Kalton, G., Roberts, J., & Holt, D. (1980). The effects of offering a middle response option with opinion questions. Journal of the Royal Statistical Society: Series D (The Statistician), 29(1), 65–78. https://doi.org/10.2307/2987495
Krosnick, J. A., & Fabrigar, L. R. (1997). Designing rating scales for effective measurement in surveys. In L. Lyberg, P. Biemer, M. Collins, E. de Leeuw, C. Dippo, N. Schwarz, & D. Trewin (Eds.), Survey measurement and process quality (pp. 141–164). Wiley. https://doi.org/10.1002/9781118490013.ch6
Krosnick, J. A., & Presser, S. (2010). Question and questionnaire design. In P. V. Marsden & J. D. Wright (Eds.), Handbook of survey research (2nd ed., pp. 263–313). Emerald.
Krosnick, J. A. (1991). Response strategies for coping with the cognitive demands of attitude measures in surveys. Applied Cognitive Psychology, 5(3), 213–236. https://doi.org/10.1002/acp.2350050305
Kulas, J. T., Stachowski, A. A., & Haynes, B. A. (2008). Middle response functioning in Likert-responses to personality items. Journal of Business and Psychology, 22(3), 251–259. https://doi.org/10.1007/s10869-008-9064-2
Malhotra, N., Krosnick, J. A., & Thomas, R. K. (2009). Optimal design of branching questions to measure bipolar constructs. Public Opinion Quarterly, 73(2), 304–324. https://doi.org/10.1093/poq/nfp023
Nadler, J. T., Weston, R., & Voyles, E. C. (2015). Stuck in the middle: The use and interpretation of mid-points in items on questionnaires. The Journal of General Psychology, 142(2), 71–89. https://doi.org/10.1080/00221309.2014.994590
Payne, S. L. (1951). The art of asking questions. Princeton University Press.
Presser, S., & Schuman, H. (1980). The measurement of a middle position in attitude surveys. Public Opinion Quarterly, 44(1), 70–85. https://doi.org/10.1086/268567
Raaijmakers, Q. A. W., van Hoof, A., 't Hart, H., Verbogt, T. F. M. A., & Vollebergh, W. A. M. (2000). Adolescents' midpoint responses on Likert-type scale items: Neutral or missing values? International Journal of Public Opinion Research, 12(2), 208–216. https://doi.org/10.1093/ijpor/12.2.208
Saris, W. E., & Gallhofer, I. N. (2014). Design, evaluation, and analysis of questionnaires for survey research (2nd ed.). Wiley. https://doi.org/10.1002/9781118634646
Schuman, H., & Presser, S. (1981). Questions and answers in attitude surveys: Experiments on question form, wording, and context. Academic Press.
Sturgis, P., Roberts, C., & Smith, P. (2014). Middle alternatives revisited: How the neither/nor response acts as a way of saying "I don't know"? Sociological Methods & Research, 43(1), 15–38. https://doi.org/10.1177/0049124112452527
Tourangeau, R., Couper, M. P., & Conrad, F. (2004). Spacing, position, and order: Interpretive heuristics for visual features of survey questions. Public Opinion Quarterly, 68(3), 368–393. https://doi.org/10.1093/poq/nfh035
Velez, P., & Ashworth, S. D. (2007). The impact of item readability on the endorsement of the midpoint response in surveys. Survey Research Methods, 1(2), 69–74. https://doi.org/10.18148/srm/2007.v1i2.76
Weijters, B., Cabooter, E., & Schillewaert, N. (2010). The effect of rating scale format on response styles: The number of response categories and response category labels. International Journal of Research in Marketing, 27(3), 236–247. https://doi.org/10.1016/j.ijresmar.2010.02.004