
Surveys · Questionnaire design
Likert Scales: Construction, Interpretation and Common Misuses
Likert scales are the most widely used format for measuring attitudes in surveys, and among the most widely misused. This article explains what a Likert scale is, how to build one properly, how to analyse and report the results, and the mistakes to avoid.
"Please indicate how strongly you agree or disagree with each statement." Few survey instructions are more familiar. The agree-disagree format, usually called a Likert scale, appears in customer surveys, employee engagement studies, academic research and public opinion polls. Its popularity is easy to understand: it is simple to write, quick to answer and can be applied to almost any topic.
Its familiarity also hides a number of problems. The term "Likert scale" is often used for things that are not Likert scales. Results are often analysed and reported in ways that the format does not support. And the agree-disagree format has known weaknesses that alternative formats can avoid. This article explains what a Likert scale is, how to construct one, how to interpret the results and which common misuses to avoid.
What a Likert scale is
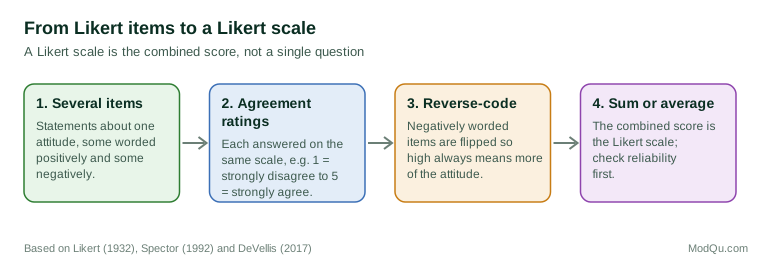
The format is named after Rensis Likert, an American social psychologist who published a method for measuring attitudes in 1932 (Likert, 1932). At the time, the main method for attitude measurement was that of Louis Thurstone, which required panels of judges to rate how favourable each statement was before it could be used (Thurstone, 1928). Likert proposed a simpler alternative. Respondents would rate their agreement with a set of statements about a topic on a five-point scale, from "strongly approve" to "strongly disapprove." Their answers would be scored, typically from 1 to 5, and added up. The total was the measure of the attitude.
Two points about Likert's method are often forgotten. First, a Likert scale is the sum of several items, not a single question. Each individual statement with agreement options is better called a Likert item or Likert-type item (Carifio & Perla, 2007). Second, the items were chosen because they measured the same underlying attitude, and they were checked statistically to make sure they did. The method was designed to produce a reliable score from several imperfect questions, on the reasoning that the random errors in individual items tend to cancel out when they are combined (Spector, 1992; DeVellis, 2017).
Constructing a Likert scale
Building a good Likert scale follows the general principles of scale development (Spector, 1992; DeVellis, 2017).
Define the construct
The first step is to define clearly what the scale is meant to measure, such as trust in a brand, satisfaction with a workplace or attitudes towards a policy. A vague definition leads to items that measure several different things.
Write a pool of items
Next, write a larger number of statements than will finally be needed, each expressing a clear position on the construct. Good items are short, use plain language, contain one idea each and avoid double negatives. They should be clearly favourable or unfavourable, because neutral statements ("I sometimes use the product") do not discriminate well between people with different attitudes (Edwards, 1957).
Balance the wording
Traditionally, scale developers include both positively and negatively worded items, such as "I trust this company" and "I am suspicious of this company's claims." The aim is to counter acquiescence, the tendency of some respondents to agree with statements regardless of content (Krosnick, 1991). If all items are worded positively, acquiescence inflates scores. With a balanced set, its effect on the total cancels out, and it can even be estimated statistically (Billiet & McClendon, 2000).
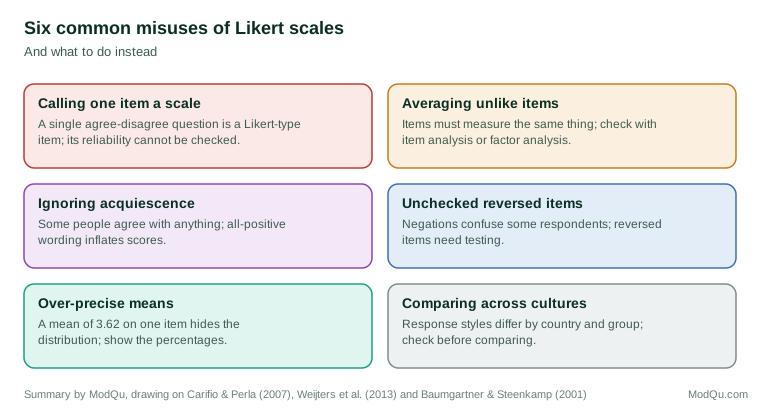
Balanced wording has costs, however. Negatively worded items, especially those that use negations such as "not," are harder to process, and some respondents misread them. As a result, reversed items often do not behave like mirror images of positive ones and can create statistical artefacts (Weijters et al., 2013). The best practice is to write reversed items as genuine opposites ("I distrust...") rather than negations ("I do not trust...") and to test them before use.
Choose the response scale
Likert's original scale had five points. Research on the number of response categories suggests that scales with very few categories are less reliable and less able to distinguish between respondents, and that reliability and validity improve up to around seven categories, with little gain beyond (Preston & Colman, 2000). Five- and seven-point scales with every point labelled are the most common choices (Krosnick & Fabrigar, 1997; Menold & Bogner, 2016). A midpoint ("neither agree nor disagree") is usually included. Numbers attached to the points should be chosen with care: an experiment found that the same verbal labels were interpreted differently when the scale was numbered from 0 to 10 than when it was numbered from −5 to +5 (Schwarz et al., 1991).
Test and refine
The item pool should be tested with a pilot sample. Item analysis identifies statements that do not correlate well with the others, which may be measuring something different or may be poorly understood. Cronbach's alpha summarises how consistently the items measure the same thing (Cronbach, 1951). Factor analysis can show whether the items reflect one underlying dimension or several. Items that perform poorly are revised or dropped.
Interpreting and analysing the results
Levels of measurement
The most debated question about Likert data is whether they can be analysed with means and other statistics that assume equal intervals between scale points. Stanley Stevens's classification of measurement scales placed rankings in an ordinal category, for which he argued that means and standard deviations were not appropriate (Stevens, 1946). Responses to a single Likert item are ordinal: "strongly agree" is more than "agree," but there is no guarantee that the distance between them equals the distance between "agree" and "neither."
Some writers argue that Likert items should therefore be analysed only with methods for ordinal data, such as medians, percentages and non-parametric tests (Jamieson, 2004). Others point out that parametric tests are robust to departures from their assumptions and work well with Likert data in practice, especially for multi-item scale scores, which have many possible values and approximate interval measurement more closely (Norman, 2010; Carifio & Perla, 2007).
A reasonable middle position is now widely accepted (Sullivan & Artino, 2013). For multi-item scale scores, means, standard deviations and parametric tests are generally acceptable. For single items, it is safer to report the distribution of answers, such as the percentage agreeing, and to use methods designed for ordinal data when precision matters. Treating ordinal items as interval data can occasionally produce misleading conclusions, for example when the groups being compared have different variances, and ordinal models avoid this (Liddell & Kruschke, 2018).
Reporting
For single items, a stacked bar showing the percentage in each response category is usually more informative than a mean. A mean of 3.4 could result from most respondents choosing the middle or from a population split between strong agreement and strong disagreement, and these call for very different responses. "Top-two box" figures (the percentage choosing the two most positive options) are common in business reporting and are easy to understand, though they discard information about the rest of the distribution.
Common misuses
Treating a single item as a scale
A single agree-disagree question is not a Likert scale and does not have the reliability of one. It can be useful, but it should be described and analysed as a single item, with its limitations acknowledged.
Combining items that do not belong together
Adding up responses to statements that measure different things produces a score that means nothing in particular. A customer survey that sums agreement with "The staff were friendly," "The price was fair" and "Parking was easy" does not measure a single attitude. Item analysis and factor analysis should confirm that items belong together before they are combined.
Ignoring response styles
Respondents differ in how they use rating scales. Some tend to agree, some tend to choose extreme points and some tend to choose the middle. These response styles can bias scale scores, and they differ across countries and cultural groups, which can make international comparisons misleading. A study of consumers in eleven European Union countries found substantial differences in response styles between countries, large enough to distort comparisons of scale scores (Baumgartner & Steenkamp, 2001). Balanced item wording and statistical adjustments can reduce the problem.
Using agree-disagree when a better format exists
The agree-disagree format is convenient because it can be applied to any statement, but it adds a step to the respondent's task: they must form a view about the topic and then translate it into agreement with a particular statement. Questions that ask directly about the dimension of interest, with item-specific response options, avoid this step. Instead of asking for agreement with "My health is excellent," an item-specific question asks "How would you rate your health?" with options from "excellent" to "poor." Comparisons across many surveys have found that item-specific questions generally have higher reliability and validity than agree-disagree items (Saris et al., 2010). Studies of how respondents process the two formats support the same conclusion (Höhne & Lenzner, 2018). For many purposes, item-specific questions are the better choice (Krosnick & Presser, 2010).
A worked example
Suppose a company wants to measure customers' trust in its brand. A first draft might contain ten statements, such as "This company keeps its promises," "This company is honest about its products," "I can rely on this company's advice," "This company would take advantage of me if it could" and "This company's prices are reasonable."
A review against the definition of trust would remove the statement about prices, which concerns value rather than trust. Pilot testing with a few hundred customers might then show that the statement about taking advantage correlates only weakly with the others, perhaps because some respondents were confused by its negative wording, so it is rewritten as a genuine opposite: "This company puts its own interests ahead of mine." Item analysis might show that two statements are almost identical in meaning and that one can be dropped without loss.
The final scale might contain six items with a Cronbach's alpha of around 0.85 (illustrative figure), answered on a five-point labelled agreement scale. Each customer's score is the average of their six answers after reverse-coding the negative item, giving a number between 1 and 5. Because the score combines several items, differences between customer groups can be compared with reasonable confidence. The individual items remain useful for diagnosis: if trust falls, the item-level distributions show whether the fall is in perceived honesty, reliability or something else.
Likert items in business surveys
Business surveys often use single agree-disagree items as quick measures of many different things: "The checkout process was easy," "I would recommend this product," "My manager supports my development." Used this way, each item is a rough indicator, not a scale. That can be acceptable for monitoring, but decisions should take into account that single items are less reliable than multi-item scales and that agree-disagree wording tends to inflate positive results through acquiescence. Where a particular measure drives important decisions, such as a bonus linked to an employee engagement score, the investment in a properly developed multi-item scale is worthwhile.
Practical recommendations
- Use several items for any important construct, and check that they belong together before combining them.
- Write clear, single-idea statements, and prefer genuine opposites to negations for reversed items.
- Use five or seven labelled points with a midpoint, unless there is a reason to do otherwise.
- Report distributions for single items and use means mainly for multi-item scores.
- Consider item-specific questions instead of agree-disagree statements, especially for single-item measures.
- Be cautious when comparing groups whose response styles may differ, such as people in different countries.
Conclusion
Likert's method was designed to turn several imperfect agree-disagree items into a reliable measure of an attitude. Used that way, with carefully written items, a sensible response scale and statistical checks, it remains a sound and practical tool. The problems arise when single items are treated as scales, unlike items are combined, response styles are ignored and results are reported with more precision than the data support. Understanding what a Likert scale is, and when an alternative format would serve better, makes survey results more accurate and more useful for decisions.
References
Baumgartner, H., & Steenkamp, J.-B. E. M. (2001). Response styles in marketing research: A cross-national investigation. Journal of Marketing Research, 38(2), 143–156. https://doi.org/10.1509/jmkr.38.2.143.18840
Billiet, J. B., & McClendon, M. J. (2000). Modeling acquiescence in measurement models for two balanced sets of items. Structural Equation Modeling, 7(4), 608–628. https://doi.org/10.1207/S15328007SEM0704_5
Carifio, J., & Perla, R. J. (2007). Ten common misunderstandings, misconceptions, persistent myths and urban legends about Likert scales and Likert response formats and their antidotes. Journal of Social Sciences, 3(3), 106–116. https://doi.org/10.3844/jssp.2007.106.116
Cronbach, L. J. (1951). Coefficient alpha and the internal structure of tests. Psychometrika, 16(3), 297–334. https://doi.org/10.1007/BF02310555
DeVellis, R. F. (2017). Scale development: Theory and applications (4th ed.). SAGE.
Edwards, A. L. (1957). Techniques of attitude scale construction. Appleton-Century-Crofts.
Höhne, J. K., & Lenzner, T. (2018). New insights on the cognitive processing of agree/disagree and item-specific questions. Journal of Survey Statistics and Methodology, 6(3), 401–417. https://doi.org/10.1093/jssam/smx028
Jamieson, S. (2004). Likert scales: How to (ab)use them. Medical Education, 38(12), 1217–1218. https://doi.org/10.1111/j.1365-2929.2004.02012.x
Krosnick, J. A., & Fabrigar, L. R. (1997). Designing rating scales for effective measurement in surveys. In L. Lyberg, P. Biemer, M. Collins, E. de Leeuw, C. Dippo, N. Schwarz, & D. Trewin (Eds.), Survey measurement and process quality (pp. 141–164). Wiley. https://doi.org/10.1002/9781118490013.ch6
Krosnick, J. A., & Presser, S. (2010). Question and questionnaire design. In P. V. Marsden & J. D. Wright (Eds.), Handbook of survey research (2nd ed., pp. 263–313). Emerald.
Krosnick, J. A. (1991). Response strategies for coping with the cognitive demands of attitude measures in surveys. Applied Cognitive Psychology, 5(3), 213–236. https://doi.org/10.1002/acp.2350050305
Liddell, T. M., & Kruschke, J. K. (2018). Analyzing ordinal data with metric models: What could possibly go wrong? Journal of Experimental Social Psychology, 79, 328–348. https://doi.org/10.1016/j.jesp.2018.08.009
Likert, R. (1932). A technique for the measurement of attitudes. Archives of Psychology, 22(140), 1–55.
Menold, N., & Bogner, K. (2016). Design of rating scales in questionnaires (GESIS Survey Guidelines). GESIS – Leibniz Institute for the Social Sciences. https://doi.org/10.15465/gesis-sg_en_015
Norman, G. (2010). Likert scales, levels of measurement and the "laws" of statistics. Advances in Health Sciences Education, 15(5), 625–632. https://doi.org/10.1007/s10459-010-9222-y
Preston, C. C., & Colman, A. M. (2000). Optimal number of response categories in rating scales: Reliability, validity, discriminating power, and respondent preferences. Acta Psychologica, 104(1), 1–15. https://doi.org/10.1016/S0001-6918(99)00050-5
Saris, W. E., Revilla, M., Krosnick, J. A., & Shaeffer, E. M. (2010). Comparing questions with agree/disagree response options to questions with item-specific response options. Survey Research Methods, 4(1), 61–79. https://doi.org/10.18148/srm/2010.v4i1.2682
Schwarz, N., Knäuper, B., Hippler, H.-J., Noelle-Neumann, E., & Clark, L. (1991). Rating scales: Numeric values may change the meaning of scale labels. Public Opinion Quarterly, 55(4), 570–582. https://doi.org/10.1086/269282
Spector, P. E. (1992). Summated rating scale construction: An introduction. SAGE. https://doi.org/10.4135/9781412986038
Stevens, S. S. (1946). On the theory of scales of measurement. Science, 103(2684), 677–680. https://doi.org/10.1126/science.103.2684.677
Sullivan, G. M., & Artino, A. R., Jr. (2013). Analyzing and interpreting data from Likert-type scales. Journal of Graduate Medical Education, 5(4), 541–542. https://doi.org/10.4300/JGME-5-4-18
Thurstone, L. L. (1928). Attitudes can be measured. American Journal of Sociology, 33(4), 529–554. https://doi.org/10.1086/214483
Weijters, B., Baumgartner, H., & Schillewaert, N. (2013). Reversed item bias: An integrative model. Psychological Methods, 18(3), 320–334. https://doi.org/10.1037/a0032121