
Surveys · Questionnaire design
Don't Know and Prefer Not to Say: Handling Non-Substantive Responses
Answers such as "don't know", "no opinion", "not applicable" and "prefer not to say" are different and need different handling. This article reviews the evidence on offering these options, explains what they mean and sets out how to design and analyse questions that include them.
Not every survey respondent can or will give a substantive answer to every question. Some do not know the answer. Some have no opinion. For some, the question does not apply. Others know the answer but would rather not share it. Survey researchers call these non-substantive responses, and how a questionnaire handles them has a large effect on the results.
Offering an explicit "don't know" option can raise the share of respondents who choose it by 20 percentage points or more. Leaving it out can produce opinions that respondents do not really hold. Treating "prefer not to say" in the same way as "don't know" can hide important differences between the people who give these answers. This article explains what the different non-substantive responses mean, reviews the evidence on when to offer them and sets out practical guidance for design and analysis.
Four different answers
The four common non-substantive responses reflect different situations and call for different design decisions (Beatty & Herrmann, 2002).
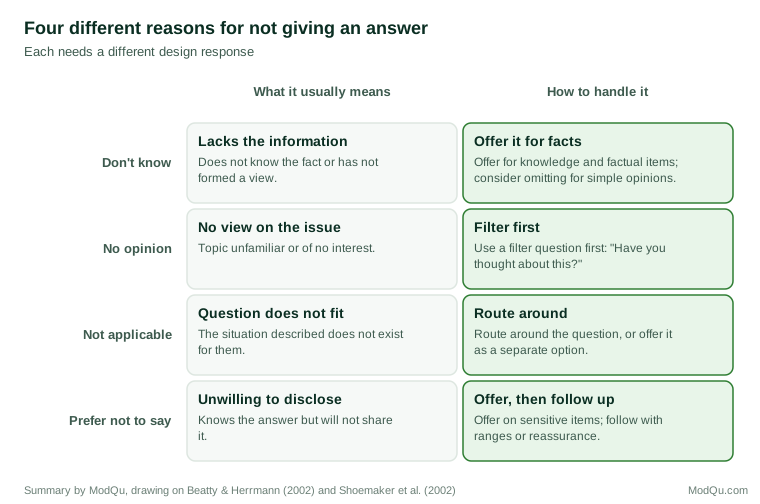
- Don't know means the respondent lacks the information needed to answer. It is appropriate for factual and knowledge questions, such as the name of a supplier or the year a product was bought.
- No opinion means the respondent has not formed a view, usually because the issue is unfamiliar or unimportant to them.
- Not applicable means the question does not fit the respondent's situation, for example a question about a partner's employment asked of someone without a partner.
- Prefer not to say means the respondent knows the answer but chooses not to give it, usually because the question is sensitive.
These answers are often lumped together as missing data, but research shows that they arise from different processes. Shoemaker and colleagues found that "don't know" responses were associated with the cognitive difficulty of a question, while refusals were associated with its sensitivity (Shoemaker et al., 2002). Beatty and Herrmann described item nonresponse as the result of a decision, in which respondents weigh what they know, how confident they are in it and how comfortable they are in reporting it (Beatty & Herrmann, 2002). A good questionnaire distinguishes these situations rather than offering a single catch-all option.
The problem of opinions that are not there
The case for offering "don't know" or "no opinion" rests on a well-established finding: when such options are not offered, many people give opinions on topics they know nothing about.
Philip Converse showed in the 1960s that answers to some opinion questions in panel surveys were so unstable over time that they looked close to random, and he argued that many respondents were giving "non-attitudes" to satisfy the interviewer (Converse, 1964). Later research gave a vivid demonstration. George Bishop and colleagues asked respondents about the "1975 Public Affairs Act," a law that did not exist. About a third of respondents offered an opinion on whether it should be repealed when no "don't know" option was explicitly offered (Bishop et al., 1980). Schuman and Presser obtained similar results with obscure but real laws, such as the Agricultural Trade Act, and found that a filter question asking whether respondents had an opinion greatly reduced the number expressing one (Schuman & Presser, 1981).
Schuman and Presser also found that the effect of filters was large in general. Explicitly offering a "no opinion" option, or asking a filter question first, typically increased the share giving no opinion by around 20 percentage points. People who moved to "no opinion" when it was offered were called floaters, and they tended to be less educated and less interested in the topic. Jean Converse had earlier shown that the share of "no opinion" answers in polls was predictable from the topic and from respondents' education (Converse, 1976).
The problem of opinions that are hidden
If filters simply removed meaningless answers, the decision would be easy. But later research found that "don't know" options also remove meaningful ones.
Jon Krosnick and colleagues tested the effects of no-opinion options in a series of experiments embedded in national surveys. They found that offering the options did not improve the reliability or validity of the answers given. Respondents attracted to "no opinion" were not mainly people without opinions, but disproportionately those with lower education, lower motivation and less time, and they were most likely to choose it late in the questionnaire (Krosnick et al., 2002). The authors concluded that, for many respondents, "no opinion" was a way to avoid the effort of answering, a form of satisficing (Krosnick, 1991), not a report of genuine absence of opinion.
A similar debate has taken place over knowledge questions. Jeffery Mondak argued that "don't know" answers on political knowledge tests hide partial knowledge, and showed that discouraging them led to higher knowledge scores, especially among groups that are more reluctant to guess (Mondak & Davis, 2001). Robert Luskin and John Bullock replied that most "don't know" answers do reflect a lack of knowledge, since the guesses of people pushed to answer were scarcely better than chance (Luskin & Bullock, 2011). The disagreement shows that the meaning of "don't know" depends on the question and the respondent.
The middle option on a rating scale is related. Some respondents choose "neither agree nor disagree" when they mean "don't know," which blurs the line between neutrality and lack of opinion (Sturgis et al., 2014). Offering a separate, clearly distinguished "don't know" option can keep the midpoint for genuinely neutral answers.
When to offer each option
The evidence suggests that the right choice depends on the question.
Factual and knowledge questions. When respondents may genuinely not know the answer, such as the cost of a household repair or the brand of a product bought years ago, "don't know" should normally be offered. Forcing an answer invites guesses that look like real data.
Opinion questions on familiar topics. When almost everyone can be expected to hold a view, such as satisfaction with a service they have just used, an explicit "don't know" option may do more harm than good, because it invites satisficing (Krosnick et al., 2002). Respondents can still skip the question in a self-administered survey or volunteer "don't know" to an interviewer.
Opinion questions on unfamiliar topics. When many respondents may know little about the issue, such as a new regulation or a technical product feature, a filter question ("Have you heard of...?" or "Do you have an opinion on...?") should come first, with the main question asked only of those who do.
Questions that do not apply to everyone. These are best handled by routing: a screening question establishes whether the situation applies, and only those for whom it does see the main question. Where routing is not possible, a "not applicable" option should be separate from "don't know."
Sensitive questions. Income, health, sexual behaviour and similar topics should normally include "prefer not to say." It respects respondents' privacy and, importantly, separates refusals from other missing answers. Without it, some respondents will give false answers or abandon the survey.
Design details that matter
How the options are presented affects how often they are used.
In interviewer surveys, "don't know" can be accepted when volunteered without being read out as an option. This produces fewer non-substantive responses than reading it aloud, while still allowing genuine "don't know" answers.
In web surveys, there is no interviewer to accept a volunteered answer, so designers must choose between showing the option, hiding it or allowing respondents to skip. One experiment found that not displaying "don't know," but allowing respondents to leave a question blank and then prompting them once, reduced non-substantive answers compared with displaying the option, without forcing an answer (DeRouvray & Couper, 2002). Brief motivational messages shown after a question is skipped, explaining why the answer is useful, have also been found to reduce missing answers in web surveys (Al Baghal & Lynn, 2015). When non-substantive options are displayed, they should be visually separated from the substantive scale, so that they are not mistaken for its endpoint or midpoint (Dillman et al., 2014).
Forcing answers by making every question compulsory is not a solution. It may raise completion rates on each item but tends to increase break-offs and produce low-quality answers from respondents who would otherwise have skipped (de Leeuw et al., 2003).
Recovering partial answers
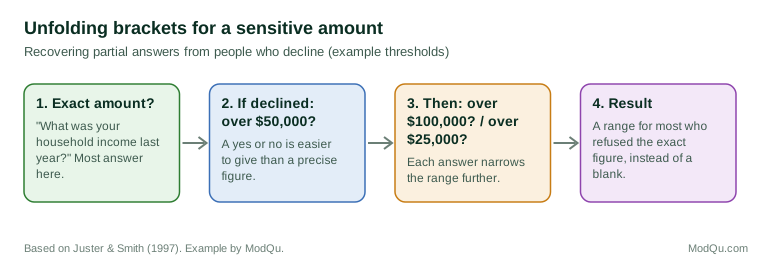
For sensitive numeric questions, a respondent who will not give an exact figure may still be willing to say roughly where it lies. The unfolding brackets technique asks those who decline a series of yes/no questions, such as "Is it more than $50,000?", to place the amount in a range. The method was developed for economic surveys of older Americans, where it substantially reduced missing data on income and wealth and improved estimates of their distribution (Juster & Smith, 1997). Income is a particularly important case, because it has some of the highest rates of item nonresponse in surveys, and the people who do not answer differ from those who do (Moore et al., 2000).
Analysing non-substantive responses
Non-substantive answers should not simply be deleted. Three practices help.
- Report them. The share of respondents choosing "don't know" or "prefer not to say" is a finding in itself. A high share signals an unfamiliar topic, a confusing question or a sensitive issue.
- Keep categories separate. "Don't know," "not applicable" and "prefer not to say" should be coded separately so that they can be analysed separately.
- Handle missing data carefully. Dropping respondents with missing answers can bias results if those respondents differ from others. Statistical methods such as multiple imputation can reduce this bias when the reasons for missing answers are related to measured characteristics (Little & Rubin, 2019), but they do not fix data that are missing because of the unobserved answer itself.
Implications for business surveys
In customer and market research, non-substantive answers carry practical information. A high "don't know" rate on a question about a competitor's prices shows that customers are not comparing, which may matter more than the average price they guess. A high "not applicable" rate on a question about a product feature shows how few customers use it. A rise in "prefer not to say" on an income question between two waves may signal a change in the sample or in trust, not in income.
Business surveys also tend to ask about topics that are familiar to the researcher but not to the respondent, such as brand names, product categories or internal service labels. These are exactly the conditions in which respondents give opinions on things they do not know. A short awareness question before asking for ratings ("Before today, had you heard of...?") prevents respondents from rating brands they have never encountered and makes the ratings that remain more meaningful.
Conclusion
"Don't know," "no opinion," "not applicable" and "prefer not to say" are different answers with different meanings. Offering them reduces the number of invented opinions and protects privacy, but it can also give respondents an easy way to avoid thinking about a question. The evidence supports offering "don't know" on factual and knowledge questions, using filter questions on unfamiliar topics, routing around questions that do not apply and including "prefer not to say" on sensitive items, while being more cautious about explicit no-opinion options on familiar topics. Careful presentation, separate coding and honest reporting of non-substantive answers make the most of what respondents can and will tell us (Groves et al., 2009; Tourangeau & Yan, 2007).
References
Al Baghal, T., & Lynn, P. (2015). Using motivational statements in web-instrument design to reduce item-missing rates in a mixed-mode context. Public Opinion Quarterly, 79(2), 568–579. https://doi.org/10.1093/poq/nfv023
Beatty, P., & Herrmann, D. (2002). To answer or not to answer: Decision processes related to survey item nonresponse. In R. M. Groves, D. A. Dillman, J. L. Eltinge, & R. J. A. Little (Eds.), Survey nonresponse (pp. 71–85). Wiley.
Bishop, G. F., Oldendick, R. W., Tuchfarber, A. J., & Bennett, S. E. (1980). Pseudo-opinions on public affairs. Public Opinion Quarterly, 44(2), 198–209. https://doi.org/10.1086/268584
Converse, J. M. (1976). Predicting no opinion in the polls. Public Opinion Quarterly, 40(4), 515–530. https://doi.org/10.1086/268336
Converse, P. E. (1964). The nature of belief systems in mass publics. In D. E. Apter (Ed.), Ideology and discontent (pp. 206–261). Free Press.
de Leeuw, E. D., Hox, J., & Huisman, M. (2003). Prevention and treatment of item nonresponse. Journal of Official Statistics, 19(2), 153–176.
DeRouvray, C., & Couper, M. P. (2002). Designing a strategy for reducing "no opinion" responses in web-based surveys. Social Science Computer Review, 20(1), 3–9. https://doi.org/10.1177/089443930202000101
Dillman, D. A., Smyth, J. D., & Christian, L. M. (2014). Internet, phone, mail, and mixed-mode surveys: The tailored design method (4th ed.). Wiley.
Groves, R. M., Fowler, F. J., Jr., Couper, M. P., Lepkowski, J. M., Singer, E., & Tourangeau, R. (2009). Survey methodology (2nd ed.). Wiley.
Juster, F. T., & Smith, J. P. (1997). Improving the quality of economic data: Lessons from the HRS and AHEAD. Journal of the American Statistical Association, 92(440), 1268–1278. https://doi.org/10.1080/01621459.1997.10473648
Krosnick, J. A. (1991). Response strategies for coping with the cognitive demands of attitude measures in surveys. Applied Cognitive Psychology, 5(3), 213–236. https://doi.org/10.1002/acp.2350050305
Krosnick, J. A., Holbrook, A. L., Berent, M. K., Carson, R. T., Hanemann, W. M., Kopp, R. J., Mitchell, R. C., Presser, S., Ruud, P. A., Smith, V. K., Moody, W. R., Green, M. C., & Conaway, M. (2002). The impact of "no opinion" response options on data quality: Non-attitude reduction or an invitation to satisfice? Public Opinion Quarterly, 66(3), 371–403. https://doi.org/10.1086/341394
Little, R. J. A., & Rubin, D. B. (2019). Statistical analysis with missing data (3rd ed.). Wiley. https://doi.org/10.1002/9781119482260
Luskin, R. C., & Bullock, J. G. (2011). "Don't know" means "don't know": DK responses and the public's level of political knowledge. The Journal of Politics, 73(2), 547–557. https://doi.org/10.1017/S0022381611000132
Mondak, J. J., & Davis, B. C. (2001). Asked and answered: Knowledge levels when we will not take "don't know" for an answer. Political Behavior, 23(3), 199–224. https://doi.org/10.1023/A:1015015227594
Moore, J. C., Stinson, L. L., & Welniak, E. J., Jr. (2000). Income measurement error in surveys: A review. Journal of Official Statistics, 16(4), 331–361.
Schuman, H., & Presser, S. (1981). Questions and answers in attitude surveys: Experiments on question form, wording, and context. Academic Press.
Shoemaker, P. J., Eichholz, M., & Skewes, E. A. (2002). Item nonresponse: Distinguishing between don't know and refuse. International Journal of Public Opinion Research, 14(2), 193–201. https://doi.org/10.1093/ijpor/14.2.193
Sturgis, P., Roberts, C., & Smith, P. (2014). Middle alternatives revisited: How the neither/nor response acts as a way of saying "I don't know"? Sociological Methods & Research, 43(1), 15–38. https://doi.org/10.1177/0049124112452527
Tourangeau, R., & Yan, T. (2007). Sensitive questions in surveys. Psychological Bulletin, 133(5), 859–883. https://doi.org/10.1037/0033-2909.133.5.859