
Surveys · Questionnaire design
Designing Response Options That Are Exhaustive and Mutually Exclusive
Closed survey questions work only if every respondent can find exactly one answer that fits. This article explains the two basic rules for response options, the common ways they are broken, how option ranges and layout influence answers, and how to design and test options that work.
A closed survey question is only as good as its answer options. However carefully the question is worded, it fails if a respondent cannot find an option that fits, or finds two that seem equally correct. Two basic rules guard against these failures. Response options should be exhaustive, so that every respondent has an answer that applies to them, and mutually exclusive, so that each respondent's answer fits in only one place. The rules appear in every textbook on questionnaire design (Payne, 1951; Sudman & Bradburn, 1982; Bradburn et al., 2004), and they sound simple. In practice they are broken constantly, often in ways that are hard to spot until the data arrive.
This article explains the two rules, shows the most common ways they are broken, and discusses the less obvious ways in which response options affect answers: through their range, their labels, their order and their visual layout. It ends with practical advice on designing and testing response options.
The two basic rules
Exhaustive
A set of options is exhaustive when every possible respondent can find one that describes them. A question asking "How do you usually travel to work?" with the options "car," "bus" and "train" is not exhaustive: it leaves out people who walk, cycle, work from home or do not work. Those respondents must choose an option that does not apply, skip the question or abandon the survey. Each of these outcomes damages the data. A respondent who walks but chooses "bus" because it seems closest creates a false answer that cannot be detected later.
Options can be made exhaustive in three ways. The first is to list every realistic possibility, which requires knowing the population well. The second is to add a residual category such as "other (please specify)," which catches answers the designer did not anticipate. The third is to add options for respondents to whom the question does not apply, such as "does not apply" or "I do not work."
Mutually exclusive
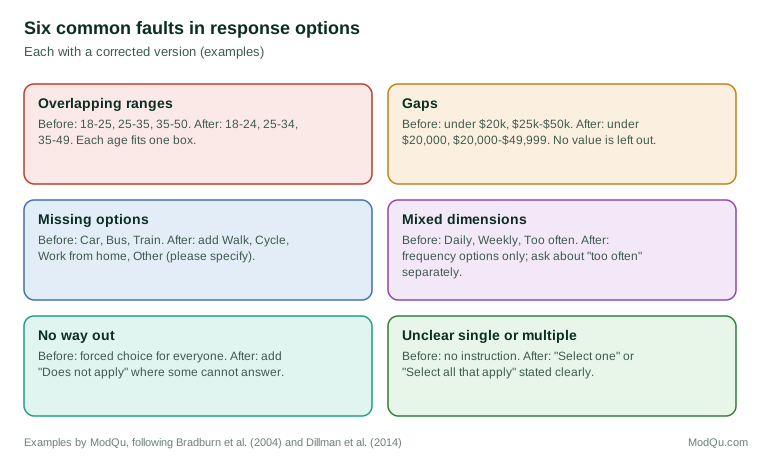
A set of options is mutually exclusive when no answer fits more than one of them. The classic failure is overlapping numeric ranges: an age question offering "18–25" and "25–35" leaves a 25-year-old with two correct answers. Some will choose one and some the other, and the distribution across the two groups becomes partly arbitrary.
Overlap is not limited to numbers. A question about employment status offering "employed," "self-employed" and "student" overlaps for a student with a part-time job. A question about the main reason for a purchase offering "price" and "value for money" asks respondents to distinguish between two ideas that many of them will see as the same thing. In such cases the options are not distinct in the minds of respondents, even if the designer had a distinction in mind.
When a respondent can genuinely belong to more than one category, there are two legitimate solutions. One is to ask for the main or most important category ("Which of these best describes your main activity?"). The other is to allow multiple answers ("Select all that apply"). The design fault is to allow only one answer when several apply, without telling respondents how to choose.
Common faults
Gaps and overlaps in numeric ranges
Numeric categories are particularly prone to error. Income categories such as "under $20,000" and "$25,000–$50,000" leave a gap: a household earning $22,000 has nowhere to go. Categories such as "$20,000–$50,000" and "$50,000–$100,000" overlap at the boundaries. The usual fix is to state the boundaries precisely, for example "$20,000 to $49,999" and "$50,000 to $99,999," and to check that each category begins exactly where the previous one ended.
Ranges should also cover the full possible span. An income question whose top category is "$100,000 or more" may be fine for a general population, but it hides most of the variation in a survey of business owners or senior professionals. An age question whose first category starts at 18 is not exhaustive if 16- and 17-year-olds can take part.
Mixed dimensions
Options sometimes mix two different dimensions in one list. "How often do you visit our website? Daily; weekly; monthly; only when I need something" combines a frequency scale with a reason. A respondent who visits weekly, always because they need something, fits two options. Options should vary along a single dimension; if a second dimension matters, it deserves a separate question.
Vague and unequal categories
Options such as "rarely," "sometimes" and "often" are mutually exclusive in a formal sense, but respondents interpret them differently, so the boundaries between them vary from person to person (Bradburn et al., 2004). Where precise frequencies matter, numeric categories ("once a week," "two or three times a week") are usually better. Categories should also be of sensible widths: a scale that offers several options for low values and one for all high values encourages respondents to see high values as unusual.
Missing "none," "don't know" and "not applicable"
Respondents who have no answer are a special case of the exhaustiveness rule. A question asking which streaming services a household uses needs a "none" option; otherwise people who use none must skip the question, and their skipping cannot be distinguished from refusal. Whether to offer "don't know" is a more complex decision. Offering it explicitly increases the number who choose it, including some who could have given a meaningful answer (Krosnick & Presser, 2010). It is most appropriate for factual or knowledge questions where some respondents genuinely cannot know the answer.
The limits of "other, please specify"
A residual "other" category is a useful safety net, but it is not a substitute for a good list. Respondents tend to choose among the options shown rather than write in an answer of their own, especially in self-administered surveys. Schuman and Presser showed that closed lists strongly shape answers, and that answers not on the list are much less likely to be given even when an "other" category is available (Schuman & Presser, 1979; Schuman & Scott, 1987). If a large share of respondents do use "other," the list is missing something important and should be revised.
Options that change over time
Lists of options can become out of date. A question about how people pay for purchases written ten years ago might not include mobile wallets; a list of social media platforms ages within months. In repeated surveys this creates a dilemma, because changing the list breaks comparability with earlier waves while keeping it makes the list less exhaustive. A common compromise is to add new options at the end of the list, keep the old ones and report results both ways for the wave in which the change is made, so that users can see how much of any shift is due to the new options.
How options change answers
Response options do more than record answers. They also tell respondents something about what is expected, and respondents use this information when they answer (Schwarz, 1999). Several features of options matter in this way.
Range
The range of numeric options suggests what is normal. When respondents were asked how many hours a day they watched television, more reported heavy viewing when the scale covered high values than when it covered low values (Schwarz et al., 1985). Respondents treated the middle of the scale as typical and placed themselves relative to it. The same effect appears with questions about frequency of shopping, exercise and many other behaviours. Where possible, numeric quantities should be asked as open questions with a number box, which removes the influence of the range. When categories are needed, they should be based on the actual distribution in the population, so that the middle categories reflect typical values.
Numeric labels on rating scales
The numbers attached to a rating scale also change its meaning. In one experiment, respondents rated how successful they had been in life on an 11-point scale. When the scale ran from 0 to 10, fewer respondents chose the lower values than when it ran from −5 to +5, even though the verbal end labels were the same. The negative numbers seem to have signalled that the low end meant explicit failure rather than merely an absence of success (Schwarz et al., 1991).
Visual layout
In web and paper surveys, the visual layout of options affects answers. Respondents use simple rules to interpret what they see: the middle option is taken to be the typical or midpoint answer, options that appear close together are taken to be similar, and options near the top or left are taken to come first in a logical order (Tourangeau et al., 2004). When the visual midpoint of a scale does not match its conceptual midpoint, for example because non-substantive options such as "don't know" are placed at the end of the row, answers shift. Equal spacing between options, a visual separation between substantive and non-substantive options and a consistent orientation help respondents read the scale correctly (Tourangeau et al., 2007; Christian et al., 2009).
Order
The order in which options appear also matters. In self-administered surveys, options near the top of a list tend to be chosen more often; in telephone interviews, options read last tend to be favoured (Krosnick & Alwin, 1987). For lists with no natural order, such as brands or reasons, randomising the order across respondents prevents any one option from benefiting consistently. For ordered scales, a consistent direction throughout the questionnaire helps respondents avoid errors.
Single choice, check-all and forced choice
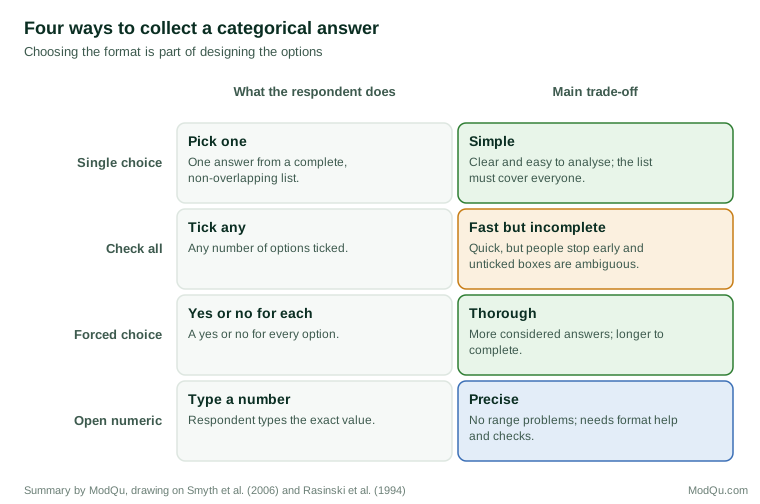
When more than one option can apply, designers must choose between a "check all that apply" format and a series of yes/no questions, one for each option (often called forced choice). The choice matters.
In a check-all format, respondents tick the options that apply and leave the rest. This is quick, but it has two weaknesses. Respondents tend to work down the list and stop once they have ticked a few options, so options lower in the list are under-reported. An unticked box is also ambiguous: it may mean "does not apply," "did not consider this option" or "did not reach this option" (Rasinski et al., 1994).
In a forced-choice format, respondents answer yes or no for each option. Experiments in web surveys have found that this format leads respondents to endorse more options and to spend longer on the question, which suggests deeper processing of each option (Smyth et al., 2006). It also distinguishes "no" from "not answered." The cost is a longer question. For short lists and important measures, forced choice is generally preferred. For long lists where the aim is a rough picture, check-all may be acceptable.
Instructions matter whichever format is used. Respondents should be told clearly whether to select one option or all that apply, and the visual design should match: round radio buttons conventionally signal a single choice, square check boxes multiple choices (Couper et al., 2004; Dillman et al., 2014).
Open numeric answers
For quantities such as age, income, number of employees or spending, an open numeric answer often avoids the problems of categories altogether. There are no boundaries to overlap and no range to suggest typical values. The cost is that respondents must produce an exact figure, which can be harder for amounts they do not know precisely, and that the answers need checking for errors and implausible values.
The design of the answer field affects data quality. Labels next to the box ("years," "dollars per month"), templates showing the expected format and boxes of an appropriate size help respondents enter well-formed answers (Christian et al., 2007; Couper et al., 2011). Web surveys can also check answers as they are entered and ask respondents to confirm values outside a plausible range.
When respondents are reluctant to give an exact figure, as with income, one practical approach is to ask for an exact amount first and then offer ranges to those who decline. Another is a sequence of questions that narrow the range step by step ("Is it more or less than $50,000?"). Both reduce missing data while preserving as much precision as respondents are willing to give.
Designing and testing response options
The following steps help ensure that options are exhaustive, mutually exclusive and interpreted as intended.
- Start from what respondents say. Open questions in pilot work show the range of answers people actually give, in their own words. Closed lists built from open answers are more complete and better understood than lists based on the designer's assumptions (Schuman & Presser, 1979; Converse & Presser, 1986).
- Check every boundary. For numeric categories, write the boundaries precisely and test them with edge cases: the youngest and oldest eligible respondents, zero values, very large values and values exactly on each boundary.
- Decide single or multiple in advance. If more than one option can apply, decide whether the question asks for the main one or for all that apply, and say so in the instruction.
- Keep to one dimension. Remove options that introduce a second concept, and ask about that concept separately.
- Provide a way out. Add "none," "does not apply" or "other (please specify)" where some respondents cannot otherwise answer, but do not rely on "other" to fix an incomplete list.
- Mind the layout. Use equal spacing, a consistent order and visual separation between substantive and non-substantive options.
- Test with real respondents. Cognitive interviews quickly show when people cannot find their answer, hesitate between two options or interpret categories differently from the designer (Willis, 2005). Pilot data show which options are rarely used, which are overused and how often "other" is chosen.
Rating scales raise further design questions, such as the number of points, whether to label every point and whether to include a midpoint. The research on these choices is extensive, and the general conclusion is that fully labelled scales with five to seven points work well for most purposes (Krosnick & Fabrigar, 1997; Saris & Gallhofer, 2014). These questions are covered in other articles in this series.
Why it matters for business decisions
Faulty response options produce numbers that look precise but are not. A market sizing study with overlapping income bands will place some customers in the wrong segment. A customer survey missing an option for a common reason for complaint will undercount that reason and overstate the others. A brand tracker that changes its list of competitors between waves will show shifts in market share that reflect the list rather than the market.
These errors are particularly costly because they are hard to detect after the data have been collected. A respondent who chose the nearest available option leaves no trace of their real answer. Time spent testing response options before a survey goes into the field is therefore one of the most cost-effective investments in data quality (Groves et al., 2009).
Conclusion
Response options are part of the question. They must give every respondent exactly one answer that fits, unless multiple answers are explicitly allowed, and they must do so in a way that respondents understand. The basic rules are to make options exhaustive and mutually exclusive, to keep them on a single dimension and to provide a way out for those to whom the question does not apply. Beyond these rules, the range, numbering, layout and order of options all influence the answers respondents give. Building options from what respondents actually say, checking every boundary and testing with real respondents are the most reliable ways to get them right.
References
Bradburn, N. M., Sudman, S., & Wansink, B. (2004). Asking questions: The definitive guide to questionnaire design for market research, political polls, and social and health questionnaires (Rev. ed.). Jossey-Bass.
Christian, L. M., Dillman, D. A., & Smyth, J. D. (2007). Helping respondents get it right the first time: The influence of words, symbols, and graphics in web surveys. Public Opinion Quarterly, 71(1), 113–125. https://doi.org/10.1093/poq/nfl039
Christian, L. M., Parsons, N. L., & Dillman, D. A. (2009). Designing scalar questions for web surveys. Sociological Methods & Research, 37(3), 393–425. https://doi.org/10.1177/0049124108330004
Converse, J. M., & Presser, S. (1986). Survey questions: Handcrafting the standardized questionnaire. SAGE. https://doi.org/10.4135/9781412986045
Couper, M. P., Kennedy, C., Conrad, F. G., & Tourangeau, R. (2011). Designing input fields for non-narrative open-ended responses in web surveys. Journal of Official Statistics, 27(1), 65–85.
Couper, M. P., Tourangeau, R., Conrad, F. G., & Crawford, S. D. (2004). What they see is what we get: Response options for web surveys. Social Science Computer Review, 22(1), 111–127. https://doi.org/10.1177/0894439303256555
Dillman, D. A., Smyth, J. D., & Christian, L. M. (2014). Internet, phone, mail, and mixed-mode surveys: The tailored design method (4th ed.). Wiley.
Groves, R. M., Fowler, F. J., Jr., Couper, M. P., Lepkowski, J. M., Singer, E., & Tourangeau, R. (2009). Survey methodology (2nd ed.). Wiley.
Krosnick, J. A., & Alwin, D. F. (1987). An evaluation of a cognitive theory of response-order effects in survey measurement. Public Opinion Quarterly, 51(2), 201–219. https://doi.org/10.1086/269029
Krosnick, J. A., & Fabrigar, L. R. (1997). Designing rating scales for effective measurement in surveys. In L. Lyberg, P. Biemer, M. Collins, E. de Leeuw, C. Dippo, N. Schwarz, & D. Trewin (Eds.), Survey measurement and process quality (pp. 141–164). Wiley. https://doi.org/10.1002/9781118490013.ch6
Krosnick, J. A., & Presser, S. (2010). Question and questionnaire design. In P. V. Marsden & J. D. Wright (Eds.), Handbook of survey research (2nd ed., pp. 263–313). Emerald.
Payne, S. L. (1951). The art of asking questions. Princeton University Press.
Rasinski, K. A., Mingay, D., & Bradburn, N. M. (1994). Do respondents really "mark all that apply" on self-administered questions? Public Opinion Quarterly, 58(3), 400–408. https://doi.org/10.1086/269434
Saris, W. E., & Gallhofer, I. N. (2014). Design, evaluation, and analysis of questionnaires for survey research (2nd ed.). Wiley. https://doi.org/10.1002/9781118634646
Schuman, H., & Presser, S. (1979). The open and closed question. American Sociological Review, 44(5), 692–712. https://doi.org/10.2307/2094521
Schuman, H., & Scott, J. (1987). Problems in the use of survey questions to measure public opinion. Science, 236(4804), 957–959. https://doi.org/10.1126/science.236.4804.957
Schwarz, N. (1999). Self-reports: How the questions shape the answers. American Psychologist, 54(2), 93–105. https://doi.org/10.1037/0003-066X.54.2.93
Schwarz, N., Hippler, H.-J., Deutsch, B., & Strack, F. (1985). Response scales: Effects of category range on reported behavior and comparative judgments. Public Opinion Quarterly, 49(3), 388–395. https://doi.org/10.1086/268936
Schwarz, N., Knäuper, B., Hippler, H.-J., Noelle-Neumann, E., & Clark, L. (1991). Rating scales: Numeric values may change the meaning of scale labels. Public Opinion Quarterly, 55(4), 570–582. https://doi.org/10.1086/269282
Smyth, J. D., Dillman, D. A., Christian, L. M., & Stern, M. J. (2006). Comparing check-all and forced-choice question formats in web surveys. Public Opinion Quarterly, 70(1), 66–77. https://doi.org/10.1093/poq/nfj007
Sudman, S., & Bradburn, N. M. (1982). Asking questions: A practical guide to questionnaire design. Jossey-Bass.
Tourangeau, R., Couper, M. P., & Conrad, F. (2004). Spacing, position, and order: Interpretive heuristics for visual features of survey questions. Public Opinion Quarterly, 68(3), 368–393. https://doi.org/10.1093/poq/nfh035
Tourangeau, R., Couper, M. P., & Conrad, F. (2007). Color, labels, and interpretive heuristics for response scales. Public Opinion Quarterly, 71(1), 91–112. https://doi.org/10.1093/poq/nfl046
Willis, G. B. (2005). Cognitive interviewing: A tool for improving questionnaire design. SAGE. https://doi.org/10.4135/9781412983655