
Surveys · Questionnaire design
Semantic Differential Scales and the Measurement of Attitudes
The semantic differential asks respondents to rate a concept between pairs of opposite adjectives. This article explains where the method came from, what it measures, how to design and analyse semantic differential scales, and when they are a better choice than agree-disagree questions.
How do customers see a brand? Is it modern or old-fashioned, warm or cold, reliable or unreliable? One of the most widely used ways to answer such questions is the semantic differential. Respondents rate a concept, such as a brand, a product, a political figure or an organisation, on a series of scales anchored at each end by a pair of opposite adjectives:
Modern ○ ○ ○ ○ ○ ○ ○ Old-fashioned
The method was developed by psychologists in the 1950s to measure the meaning that people attach to words and ideas. It has since been used in fields ranging from marketing and political science to user experience design and robotics. This article explains the origins and theory of the semantic differential, how to design and analyse a semantic differential scale, its strengths and weaknesses, and when it is preferable to the more familiar agree-disagree format.
Origins: measuring meaning
The semantic differential was developed by Charles Osgood and his colleagues at the University of Illinois as a way to measure the connotative meaning of concepts: not what a word refers to, but the feelings and associations it carries (Osgood, 1952). In their book The Measurement of Meaning, they described how respondents could rate any concept on a set of bipolar adjective scales, such as good-bad, strong-weak and fast-slow, and how the ratings could be analysed to reveal the structure of meaning (Osgood et al., 1957).
Using factor analysis on large numbers of ratings, Osgood and colleagues found that most of the variation in people's ratings could be summarised by three underlying dimensions:
- Evaluation: how good or bad the concept seems (good-bad, pleasant-unpleasant, valuable-worthless). This was consistently the largest dimension.
- Potency: how strong or powerful it seems (strong-weak, large-small, heavy-light).
- Activity: how lively or dynamic it seems (fast-slow, active-passive).
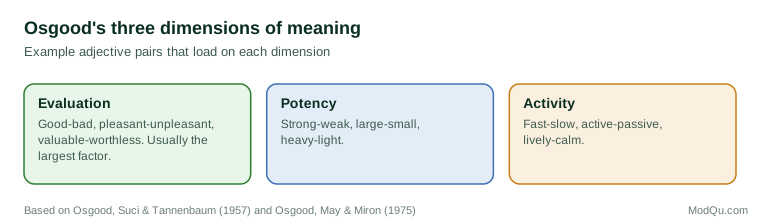
These three dimensions, often abbreviated as EPA, proved remarkably stable. In a large cross-cultural programme, Osgood and colleagues collected ratings in more than twenty language communities around the world and found that the same three dimensions emerged in each (Osgood et al., 1975). This finding gave the semantic differential a strong theoretical foundation: it appeared to tap a basic and widely shared structure in how people evaluate the world. Later researchers used EPA ratings to compare how different cultures view social roles, behaviours and emotions (Heise, 2010).
For attitude measurement, the evaluation dimension is the most important. An attitude is essentially an evaluation of an object, and evaluative adjective pairs provide a direct way to measure it. Potency and activity add information that is useful for some purposes, such as understanding a brand's personality, but they are not attitudes in themselves.
From theory to practice
Researchers in marketing quickly saw the potential of the method. William Mindak showed how the semantic differential could be adapted for measuring brand and company images, replacing abstract adjective pairs with phrases relevant to the product category and presenting the results as profiles that could be compared across brands (Mindak, 1961). Later work developed procedures for creating tailor-made sets of scales for particular marketing problems, starting from the words consumers themselves used to describe products (Dickson & Albaum, 1977).
The format is now used widely beyond marketing. Questionnaires for evaluating the user experience of software, such as AttrakDiff and the User Experience Questionnaire, are built from semantic differential items, with pairs such as "complicated-easy" and "boring-exciting" (Hassenzahl et al., 2003; Laugwitz et al., 2008). Researchers in human-robot interaction use semantic differential scales to measure how people perceive robots, for example as "machinelike-humanlike" or "unfriendly-friendly" (Bartneck et al., 2009).
Designing a semantic differential scale
Designing a good semantic differential involves choices about the concepts, the adjective pairs, the response format and the layout. A comprehensive review of the method's methodological issues remains a useful guide (Heise, 1969), and more recent work has set out practical recommendations (Verhagen et al., 2015).
Choosing adjective pairs
The adjective pairs are the heart of the method. Good pairs have several properties:
- Relevance. The pairs should make sense for the concept being rated. "Fast-slow" is meaningful for a delivery service but strange for a bank's ethics. Irrelevant pairs produce ratings near the midpoint that add noise rather than information. Researchers have recently proposed asking respondents how relevant each scale is to the concept, to identify such cases (Stoklasa et al., 2019).
- True opposites. The two adjectives should be genuine antonyms, such as "reliable-unreliable." Pairs that are not true opposites, such as "modern-traditional" for a respondent who sees tradition as a positive quality, can confuse the scale.
- Clarity. Words should be familiar to respondents and have a clear meaning. Specialist or ambiguous terms should be avoided.
- Coverage. The set of pairs should cover all the aspects of the concept that matter for the research question. Qualitative work, such as interviews or open questions, is the best way to find the words respondents themselves use (Dickson & Albaum, 1977).
Number of points
Osgood used seven-point scales, and seven remains the most common choice. Research on rating scales in general suggests that reliability and validity improve up to around seven points and gain little beyond (Preston & Colman, 2000; Krosnick & Fabrigar, 1997). Semantic differential scales are bipolar, running from one quality through a neutral midpoint to its opposite, so a midpoint is natural and should normally be included.
Labels
In the classic format, only the two ends of each scale are labelled with the adjectives, and the intermediate points are unlabelled. Some researchers add verbal labels such as "extremely," "quite" and "slightly" to the points between, which can help respondents interpret the scale consistently. Fully labelled scales are generally more reliable than scales with labels only at the ends (Krosnick & Fabrigar, 1997; Menold & Bogner, 2016), but labelling every point of every semantic differential item makes the questionnaire longer and visually busier. A common compromise is to explain the scale once at the start ("The closer you mark to a word, the more strongly you feel it describes the brand").
Direction and order
If all the positive adjectives appear on the same side, respondents may fall into a pattern of marking one side without reading each pair carefully. Randomly alternating the side on which the positive adjective appears reduces this response set, at the cost of requiring respondents to pay closer attention. The order of the pairs can also be randomised to spread order effects across them. When results are analysed, alternated items must be recoded so that the positive pole always has the same value.
Analysing semantic differential data
Profiles
The simplest analysis is a profile: the average rating of each concept on each scale, plotted so that concepts can be compared at a glance. Profiles are sometimes called snake charts because of the shape of the lines connecting the averages.
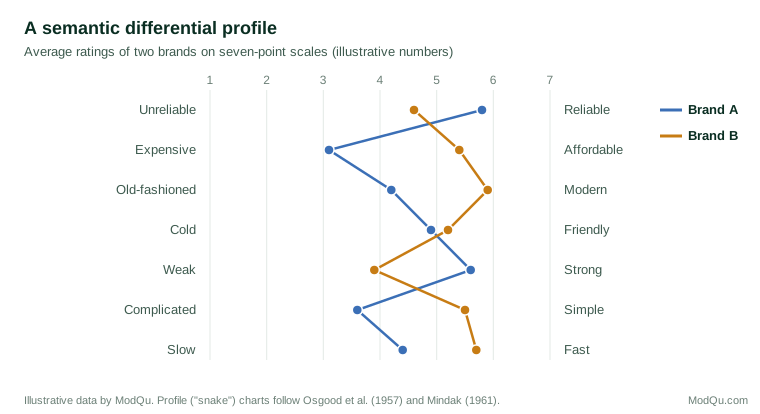
In Figure 2, which uses illustrative numbers, Brand A is seen as more reliable and stronger, while Brand B is seen as more affordable, modern, simple and fast. Such a profile is easy to understand and can guide positioning and communication decisions.
Scale scores
When several adjective pairs measure the same underlying dimension, they can be combined into a scale score, as in a Likert scale. Factor analysis shows which pairs belong together, and Cronbach's alpha measures how consistently they do so (Cronbach, 1951; DeVellis, 2017). Combining several evaluative pairs into one evaluation score produces a more reliable measure of attitude than any single pair. Factor structures should be checked for each new set of concepts, since the classic EPA structure does not always appear when the concepts or the adjectives are very specific (Heise, 1969).
Distances between concepts
Osgood also proposed measuring the overall similarity of two concepts by the distance between their profiles across all scales. This is useful for comparing, for example, how close a brand is to a customer's ideal brand, or how close two competing products are in customers' minds.
Strengths and weaknesses
Strengths
The semantic differential has several advantages over agree-disagree statements. Each item asks directly about a quality of the concept rather than asking respondents to agree with a statement about it, which removes the extra step of translating an opinion into agreement. Agree-disagree formats are vulnerable to acquiescence, the tendency of some respondents to agree regardless of content, and to the confusion caused by negatively worded statements. The semantic differential avoids both, because each scale has two meaningful poles and no statement to agree with.
One study compared Likert and semantic differential versions of a resilience scale and found that the semantic differential version showed less acquiescence and better psychometric properties (Friborg et al., 2006). This is consistent with broader evidence that questions with item-specific response options, which name the dimension being measured, tend to produce better data than agree-disagree items (Saris et al., 2010; Krosnick & Presser, 2010).
The format is also quick to answer, easy to apply to many concepts with the same set of scales and produces results that are easy to display and compare.
Weaknesses
The main weakness is that the quality of the results depends heavily on the choice of adjective pairs, and poor choices are common. Reviews of published research have found frequent problems, such as pairs that are not true opposites, pairs that are irrelevant to the concept and inadequate reporting of how scales were chosen and tested (Verhagen et al., 2015).
Midpoint responses are hard to interpret. A rating in the middle of "modern-old-fashioned" may mean that the respondent sees the brand as neither, that they see it as both, that they do not know the brand well enough to judge or that the pair is irrelevant (Stoklasa et al., 2019). Including a separate "don't know" option, or asking about familiarity first, helps.
As with all rating scales, response styles differ between people and between cultures. Some respondents use the extreme ends of scales more than others, which can distort comparisons between groups (Baumgartner & Steenkamp, 2001). The visual layout matters too: the appearance of a scale, including colour and labels, affects how respondents interpret and use it (Tourangeau et al., 2007).
Comparing formats: an example
Suppose a bank wants to know whether customers see it as trustworthy. In agree-disagree form, it might ask customers to agree or disagree with "This bank is trustworthy." In semantic differential form, it would ask customers to place the bank on a scale from "untrustworthy" to "trustworthy."
The two versions seem equivalent, but they ask for different mental work. In the agree-disagree version, a respondent who thinks the bank is moderately trustworthy must decide whether that warrants "agree" or "somewhat agree," and some respondents will agree simply because agreeing is easy. In the semantic differential version, the respondent places the bank directly on the dimension of interest, and there is no statement to agree with. The semantic differential also makes it natural to rate several banks on the same scale, which supports comparison.
A design checklist
Before fielding a semantic differential, it is worth checking each of the following:
- Source of the pairs. Were the adjective pairs drawn from how respondents describe the concepts, for example through interviews or open questions?
- Relevance. Is every pair meaningful for every concept being rated? If not, remove it or apply it only to concepts where it fits.
- Opposites. Are the two ends of each scale genuine opposites, and is one end clearly more favourable where evaluation is intended?
- Familiarity. Will respondents know each concept well enough to rate it? If not, ask about awareness or familiarity first and offer a way to say "don't know."
- Direction. Is the side of the positive pole varied across items, and is the recoding plan written down before the data arrive?
- Dimensions. Is there a plan to check, using factor analysis on pilot data, whether the pairs group into the intended dimensions before scores are combined?
- Presentation. Do the scales display clearly on mobile screens, where long rows of seven points with words at each end can be cramped?
When to use a semantic differential
The semantic differential is a strong choice when:
- The aim is to describe how people perceive a concept, such as a brand image, product personality or organisational reputation.
- Several concepts need to be compared on the same dimensions.
- The qualities of interest can be expressed as clear pairs of opposites.
- Acquiescence or confusing negative statements are a concern.
It is less suitable when the qualities of interest do not have natural opposites, when respondents may not know the concepts well enough to rate them or when the research needs to measure specific beliefs or behaviours rather than overall impressions.
Conclusion
The semantic differential began as a tool for measuring the meaning of words and became one of the most useful formats for measuring attitudes and images. Its theoretical basis, the evaluation, potency and activity dimensions found across many cultures, gives it a firm foundation, and its format avoids some of the known weaknesses of agree-disagree questions. Its value depends on careful design: relevant, clear and genuinely opposite adjective pairs, sensible scale lengths, varied directions and proper testing of whether the scales measure what they are intended to. With these in place, the semantic differential provides a compact and comparable picture of how people see the things that matter to an organisation.
References
Bartneck, C., Kulić, D., Croft, E., & Zoghbi, S. (2009). Measurement instruments for the anthropomorphism, animacy, likeability, perceived intelligence, and perceived safety of robots. International Journal of Social Robotics, 1(1), 71–81. https://doi.org/10.1007/s12369-008-0001-3
Baumgartner, H., & Steenkamp, J.-B. E. M. (2001). Response styles in marketing research: A cross-national investigation. Journal of Marketing Research, 38(2), 143–156. https://doi.org/10.1509/jmkr.38.2.143.18840
Cronbach, L. J. (1951). Coefficient alpha and the internal structure of tests. Psychometrika, 16(3), 297–334. https://doi.org/10.1007/BF02310555
DeVellis, R. F. (2017). Scale development: Theory and applications (4th ed.). SAGE.
Dickson, J., & Albaum, G. (1977). A method for developing tailormade semantic differentials for specific marketing content areas. Journal of Marketing Research, 14(1), 87–91. https://doi.org/10.1177/002224377701400110
Friborg, O., Martinussen, M., & Rosenvinge, J. H. (2006). Likert-based vs. semantic differential-based scorings of positive psychological constructs: A psychometric comparison of two versions of a scale measuring resilience. Personality and Individual Differences, 40(5), 873–884. https://doi.org/10.1016/j.paid.2005.08.015
Hassenzahl, M., Burmester, M., & Koller, F. (2003). AttrakDiff: Ein Fragebogen zur Messung wahrgenommener hedonischer und pragmatischer Qualität [AttrakDiff: A questionnaire for measuring perceived hedonic and pragmatic quality]. In G. Szwillus & J. Ziegler (Eds.), Mensch & Computer 2003 (pp. 187–196). Teubner. https://doi.org/10.1007/978-3-322-80058-9_19
Heise, D. R. (1969). Some methodological issues in semantic differential research. Psychological Bulletin, 72(6), 406–422. https://doi.org/10.1037/h0028448
Heise, D. R. (2010). Surveying cultures: Discovering shared conceptions and sentiments. Wiley.
Krosnick, J. A., & Fabrigar, L. R. (1997). Designing rating scales for effective measurement in surveys. In L. Lyberg, P. Biemer, M. Collins, E. de Leeuw, C. Dippo, N. Schwarz, & D. Trewin (Eds.), Survey measurement and process quality (pp. 141–164). Wiley. https://doi.org/10.1002/9781118490013.ch6
Krosnick, J. A., & Presser, S. (2010). Question and questionnaire design. In P. V. Marsden & J. D. Wright (Eds.), Handbook of survey research (2nd ed., pp. 263–313). Emerald.
Laugwitz, B., Held, T., & Schrepp, M. (2008). Construction and evaluation of a user experience questionnaire. In A. Holzinger (Ed.), HCI and usability for education and work (pp. 63–76). Springer. https://doi.org/10.1007/978-3-540-89350-9_6
Menold, N., & Bogner, K. (2016). Design of rating scales in questionnaires (GESIS Survey Guidelines). GESIS – Leibniz Institute for the Social Sciences. https://doi.org/10.15465/gesis-sg_en_015
Mindak, W. A. (1961). Fitting the semantic differential to the marketing problem. Journal of Marketing, 25(4), 28–33. https://doi.org/10.1177/002224296102500406
Osgood, C. E. (1952). The nature and measurement of meaning. Psychological Bulletin, 49(3), 197–237. https://doi.org/10.1037/h0055737
Osgood, C. E., May, W. H., & Miron, M. S. (1975). Cross-cultural universals of affective meaning. University of Illinois Press.
Osgood, C. E., Suci, G. J., & Tannenbaum, P. H. (1957). The measurement of meaning. University of Illinois Press.
Preston, C. C., & Colman, A. M. (2000). Optimal number of response categories in rating scales: Reliability, validity, discriminating power, and respondent preferences. Acta Psychologica, 104(1), 1–15. https://doi.org/10.1016/S0001-6918(99)00050-5
Saris, W. E., Revilla, M., Krosnick, J. A., & Shaeffer, E. M. (2010). Comparing questions with agree/disagree response options to questions with item-specific response options. Survey Research Methods, 4(1), 61–79. https://doi.org/10.18148/srm/2010.v4i1.2682
Stoklasa, J., Talášek, T., & Stoklasová, J. (2019). Semantic differential for the twenty-first century: Scale relevance and uncertainty entering the semantic space. Quality & Quantity, 53(1), 435–448. https://doi.org/10.1007/s11135-018-0762-1
Tourangeau, R., Couper, M. P., & Conrad, F. (2007). Color, labels, and interpretive heuristics for response scales. Public Opinion Quarterly, 71(1), 91–112. https://doi.org/10.1093/poq/nfl046
Verhagen, T., van den Hooff, B., & Meents, S. (2015). Toward a better use of the semantic differential in IS research: An integrative framework of suggested action. Journal of the Association for Information Systems, 16(2), 108–143. https://doi.org/10.17705/1jais.00388