
Surveys · Questionnaire design
Matrix Questions and Straightlining: Efficiency Versus Data Quality
Matrix or grid questions let respondents rate many items on one screen, but they also make it easy to give the same answer to every item. This article reviews the evidence on grids and straightlining, explains how to detect careless answers and sets out design choices that protect data quality.
Many questionnaires contain at least one matrix question, also called a grid: a table in which several items share the same response scale, with items in rows and answer options in columns. A customer survey might ask respondents to rate ten aspects of a service, from website usability to delivery speed, each on a scale from "very poor" to "excellent." Grids are popular because they are compact. They fit many questions on one screen or page, they look tidy and respondents can answer them quickly.
That speed is also the problem. A grid makes it easy for respondents to click down a single column, giving the same answer to every item without reading each one. This pattern is known as straightlining (or non-differentiation), and it is one of the most widely discussed threats to the quality of web survey data. This article explains why grids encourage straightlining, reviews the research on grid design and its effects, discusses how to identify careless responses and sets out practical guidance for using grids without sacrificing data quality.
Why grids are attractive
Grids offer real advantages. They reduce the space needed to present many questions, which shortens paper questionnaires and reduces the number of screens in web surveys. Because the response scale is shown once, respondents do not need to read it again for every item, which saves time. And because related items are presented together, respondents can see the full set of items and use a consistent standard when answering.
Research confirms that grids are faster to complete than the same questions asked one at a time (Couper et al., 2013). For long questionnaires, this efficiency can reduce the overall burden on respondents and, in turn, reduce break-offs. Designers working to keep a survey within a time budget often turn to grids for this reason.
Why grids encourage straightlining
The features that make grids efficient also make them vulnerable to low-effort answering. Answering a survey question well requires respondents to understand each item, retrieve relevant information, form a judgement and map it onto the scale (Tourangeau et al., 2004). When respondents lack motivation or ability, they may take shortcuts, a behaviour Jon Krosnick called satisficing (Krosnick, 1991). Giving the same answer to a series of items is one of the most obvious shortcuts, and grids make it physically easy: the respondent only needs to click straight down a column.
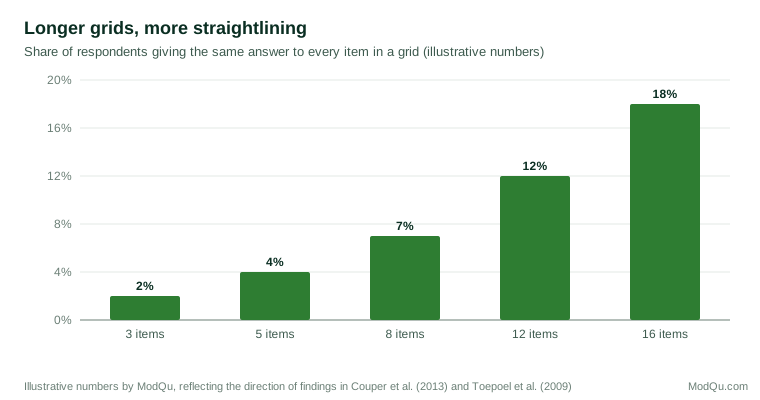
Grids also encourage respondents to treat items as a set. When items appear together, respondents tend to see them as related and to answer them more similarly, which raises the correlations between items. Some of this similarity may be genuine, but some reflects the format itself. Experiments that varied the number of items per screen found that placing more items together increased the correlations between them, and that respondents spent less time per item (Toepoel et al., 2009). Similar effects have been found for grids compared with item-by-item presentation (Couper et al., 2013).
The problem grows with the length of the grid and the length of the questionnaire. Long batteries of similar items invite fatigue, and items that appear later in a long questionnaire tend to receive less careful answers. An early study of a long-running American survey of school students found that straightlining increased in later parts of the questionnaire (Herzog & Bachman, 1981), and an experiment in a web survey found that answers to questions placed later in a longer questionnaire were faster and showed more signs of low effort (Galesic & Bosnjak, 2009).
Grids and the meaning of correlations
The tendency of grids to make answers more similar matters most for analyses that rely on the relationships between items. Many studies combine grid items into scales, check their reliability with statistics such as Cronbach's alpha and examine their structure with factor analysis. If the grid format itself raises the correlations between items, these statistics will look better than they should. A scale may appear more reliable, or a set of items may appear to measure a single dimension, partly because respondents answered them as a block.
This is a particular concern when grids are compared with other formats, or when the same questions are asked in a grid in one survey and item by item in another. Differences in reliability or structure between the two may reflect presentation rather than any real difference between the groups surveyed. Survey designers who plan to compare results across modes, devices or time periods should keep the presentation of key batteries constant, or test the effect of changing it.
Straightlining can also mimic substantive results. If a group of respondents straightlines at the positive end of a satisfaction scale, the group will appear more satisfied, and the items will appear strongly related. Analysts who see unusually high agreement or unusually high correlations in one subgroup should check whether straightlining is concentrated there.
Grids on mobile devices
The growth of smartphone use has made grids more problematic. A grid with seven or more columns does not fit comfortably on a phone screen, and respondents must zoom, scroll sideways or tap very small targets. Many survey platforms therefore convert grids to a different layout on small screens, often presenting each item as a separate question with stacked response options.
Research comparing formats across devices has found that grids perform worse on smartphones than on computers, with more straightlining and more errors, and that item-by-item formats work better on phones (Mavletova et al., 2018; Revilla & Couper, 2018). The differences between grids and item-by-item formats also depend on the number of response options: grids with many options cause more problems than grids with few (Liu & Cernat, 2018). These findings have led many designers to adopt a "mobile-first" approach in which grids are avoided or kept very short.
Is straightlining always a problem?
It is tempting to treat every straightlined response as careless, but this is not always correct. If a respondent genuinely holds the same view about every item, identical answers are accurate. A customer who was fully satisfied with every aspect of a service may legitimately choose "very satisfied" for all ten items.
Whether straightlining signals poor data depends on the items. When items are closely related and all worded in the same direction, consistent answers are plausible. When items are worded in opposite directions, so that a consistent attitude should produce different answers, identical answers are much more likely to indicate that the respondent did not read the items. Researchers have argued that analysts should distinguish valid from invalid straightlining, and they have shown that removing all straightliners from a dataset can itself introduce bias, because straightlining is related to respondent characteristics such as age and education (Reuning & Plutzer, 2020).
How straightlining is measured also matters. Indicators range from the strict definition (identical answers to every item in a grid) to measures of how little variation there is in a respondent's answers. Different indicators identify different respondents, and the choice of indicator can affect conclusions about data quality (Kim et al., 2019). Straightlining is also not a fixed trait. Studies of long-running web panels show that it varies across occasions and topics (Schonlau & Toepoel, 2015).
Detecting careless responses
Straightlining is one of several signs that a respondent may not be answering carefully. Research on careless responding suggests combining several indicators (Meade & Craig, 2012; Curran, 2016):
- Straightlining or low variation within grids, especially across items worded in opposite directions.
- Speeding: completing the questionnaire much faster than is plausible for reading the questions. Respondents who answer very quickly are more likely to straightline (Zhang & Conrad, 2014).
- Inconsistent answers to pairs of items that should agree, or to the same question asked twice.
- Attention checks, such as an instruction embedded in a question ("To show you are reading, please select 'somewhat disagree' for this item"). Such checks identify respondents who are not reading instructions (Oppenheimer et al., 2009).
- Open answers that are blank, nonsensical or copied.
These indicators should be used with care. Attention checks can irritate attentive respondents, and excluding everyone who fails one can bias the sample, since failure rates differ between demographic groups (Berinsky et al., 2014). A common approach is to flag respondents who show several warning signs, examine their data and decide on exclusion using rules set before the data are analysed.
Designing better grids
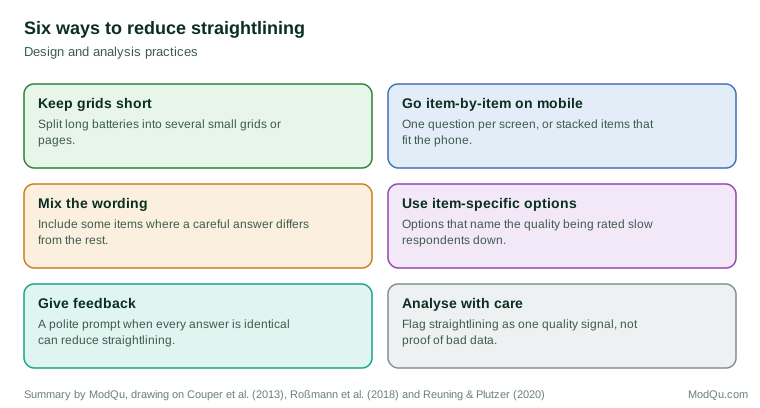
Grids do not have to be abandoned, but they should be designed carefully.
Keep grids short
The simplest remedy is to limit the number of items in each grid. Five to seven items is a common practical maximum. Longer batteries can be split into several smaller grids, preferably on separate screens, with a short introduction to each.
Use few, clearly labelled response options
Grids with many columns are harder to read and to answer, especially on mobile devices. Five-point scales with every point labelled are generally easier for respondents than longer scales in grid form (Liu & Cernat, 2018). Labels should be repeated at the top of the grid or kept visible as the respondent scrolls.
Make the layout readable
Visual design affects how respondents process grids. Shading alternate rows, giving rows enough height and leaving space between the substantive scale and options such as "not applicable" all help. Dynamic features, such as shading a row once it has been answered, can reduce missed items (Couper et al., 2013). Respondents use the visual layout to interpret the scale, so equal spacing between columns and a clear midpoint matter (Tourangeau et al., 2004).
Present items one at a time on small screens
On smartphones, item-by-item presentation, with each item on its own screen or as a stacked list, generally produces better data than a grid (Mavletova et al., 2018). Where the same questionnaire is used on computers and phones, designers should check how the grid is rendered on each device and test it on real phones.
Vary item wording carefully
Including some items worded in the opposite direction makes straightlining detectable and discourages it, because a careful respondent cannot give the same answer to all items. Reversed items have their own problems, however: some respondents misread them, especially when they use negations (Weijters et al., 2013). Reversed items should be clear opposites rather than negations and should be tested before use.
Give feedback
Web surveys can respond to straightlining as it happens. Experiments have found that a polite prompt shown to respondents who give identical answers to every item in a grid, asking them to check their answers, reduces straightlining in later grids (Roßmann et al., 2018). Such prompts should be used sparingly, since repeated warnings can annoy respondents.
Reduce overall burden
Straightlining is a symptom of fatigue and low motivation as much as of grid design. Shorter questionnaires, clear explanations of why the survey matters and appropriate incentives all help respondents stay engaged (Galesic & Bosnjak, 2009; Dillman et al., 2014). Placing the most important grids early, before fatigue sets in, protects the key measures.
An example: redesigning a satisfaction battery
Consider a retailer whose annual customer survey contains a single grid of sixteen statements about the shopping experience, each rated on a seven-point agreement scale. Analysis of last year's data shows that about one respondent in six gave the same answer to all sixteen items, that this share was much higher among respondents on phones and that almost all of the straightliners chose "agree" or "strongly agree" (illustrative figures). The overall satisfaction results are therefore inflated, and the item-level results are hard to interpret.
A redesign might take the following steps. First, the sixteen items are reviewed, and four that duplicate others or are rarely used in decisions are removed. Second, the remaining twelve are divided into three groups of four by topic, such as the website, the store and delivery, each on its own screen with a short heading. Third, the agreement scale is replaced with item-specific five-point scales, so that "The website was easy to use" becomes "How easy or difficult was the website to use?" with options from "very easy" to "very difficult." Fourth, two items are worded so that a satisfied customer would give a low score, using clear opposites rather than negations. Finally, on phones each item appears as a separate question with stacked response options.
After the redesign, the retailer can expect fewer straightliners, clearer differences between items and results that are comparable across devices. The trade-off is that the survey takes slightly longer for some respondents, and that results are not directly comparable with earlier years. A split-sample test, in which part of the sample receives the old design and part the new one in the first year, allows the size of the change to be measured and reported.
Reporting data quality
Surveys that use grids should report basic data quality indicators alongside their results: the share of respondents who straightlined each major grid, the share flagged by other indicators such as speeding and how flagged cases were handled. These figures help users judge how much confidence to place in the results and allow comparisons between waves. They also create an incentive to keep grids short and well designed, since a rising straightlining rate is an early sign that a questionnaire has become too long or too repetitive.
When to use grids
Grids remain a reasonable choice when:
- A small number of closely related items share a natural response scale.
- Most respondents will answer on a computer or tablet.
- Efficiency matters and the items are not the central measures of the survey.
Item-by-item presentation is preferable when:
- Many respondents will use smartphones.
- The items are central to the survey's purpose.
- The items are diverse, so that respondents should consider each one separately.
- The response scale has many points.
Item-specific response options, which name the quality being rated rather than asking for agreement, can also help, because they make respondents consider each item rather than applying a single agreement level to all (Krosnick & Presser, 2010).
Conclusion
Matrix questions save space and time, but they make it easy for respondents to give the same answer to every item without reading them. The risk rises with the length of the grid, the length of the questionnaire, the number of response options and the use of small screens. Not every straightlined answer is careless, so straightlining should be treated as a warning sign to be examined, not automatic proof of bad data. Short grids, readable layouts, item-by-item presentation on mobile devices, carefully varied wording and timely feedback all reduce the problem (Couper, 2008; Callegaro et al., 2015). The goal is not to eliminate grids but to use them only where their efficiency does not come at the cost of the answers.
References
Berinsky, A. J., Margolis, M. F., & Sances, M. W. (2014). Separating the shirkers from the workers? Making sure respondents pay attention on self-administered surveys. American Journal of Political Science, 58(3), 739–753. https://doi.org/10.1111/ajps.12081
Callegaro, M., Lozar Manfreda, K., & Vehovar, V. (2015). Web survey methodology. SAGE. https://doi.org/10.4135/9781529799651
Couper, M. P. (2008). Designing effective web surveys. Cambridge University Press. https://doi.org/10.1017/CBO9780511499371
Couper, M. P., Tourangeau, R., Conrad, F. G., & Zhang, C. (2013). The design of grids in web surveys. Social Science Computer Review, 31(3), 322–345. https://doi.org/10.1177/0894439312469865
Curran, P. G. (2016). Methods for the detection of carelessly invalid responses in survey data. Journal of Experimental Social Psychology, 66, 4–19. https://doi.org/10.1016/j.jesp.2015.07.006
Dillman, D. A., Smyth, J. D., & Christian, L. M. (2014). Internet, phone, mail, and mixed-mode surveys: The tailored design method (4th ed.). Wiley.
Galesic, M., & Bosnjak, M. (2009). Effects of questionnaire length on participation and indicators of response quality in a web survey. Public Opinion Quarterly, 73(2), 349–360. https://doi.org/10.1093/poq/nfp031
Herzog, A. R., & Bachman, J. G. (1981). Effects of questionnaire length on response quality. Public Opinion Quarterly, 45(4), 549–559. https://doi.org/10.1086/268687
Kim, Y., Dykema, J., Stevenson, J., Black, P., & Moberg, D. P. (2019). Straightlining: Overview of measurement, comparison of indicators, and effects in mail–web mixed-mode surveys. Social Science Computer Review, 37(2), 214–233. https://doi.org/10.1177/0894439317752406
Krosnick, J. A., & Presser, S. (2010). Question and questionnaire design. In P. V. Marsden & J. D. Wright (Eds.), Handbook of survey research (2nd ed., pp. 263–313). Emerald.
Krosnick, J. A. (1991). Response strategies for coping with the cognitive demands of attitude measures in surveys. Applied Cognitive Psychology, 5(3), 213–236. https://doi.org/10.1002/acp.2350050305
Liu, M., & Cernat, A. (2018). Item-by-item versus matrix questions: A web survey experiment. Social Science Computer Review, 36(6), 690–706. https://doi.org/10.1177/0894439316674459
Mavletova, A., Couper, M. P., & Lebedev, D. (2018). Grid and item-by-item formats in PC and mobile web surveys. Social Science Computer Review, 36(6), 647–668. https://doi.org/10.1177/0894439317735307
Meade, A. W., & Craig, S. B. (2012). Identifying careless responses in survey data. Psychological Methods, 17(3), 437–455. https://doi.org/10.1037/a0028085
Oppenheimer, D. M., Meyvis, T., & Davidenko, N. (2009). Instructional manipulation checks: Detecting satisficing to increase statistical power. Journal of Experimental Social Psychology, 45(4), 867–872. https://doi.org/10.1016/j.jesp.2009.03.009
Reuning, K., & Plutzer, E. (2020). Valid vs. invalid straightlining: The complex relationship between straightlining and data quality. Survey Research Methods, 14(5), 439–459. https://doi.org/10.18148/srm/2020.v14i5.7641
Revilla, M., & Couper, M. P. (2018). Comparing grids with vertical and horizontal item-by-item formats for PCs and smartphones. Social Science Computer Review, 36(3), 349–368. https://doi.org/10.1177/0894439317715626
Roßmann, J., Gummer, T., & Silber, H. (2018). Mitigating satisficing in cognitively demanding grid questions: Evidence from two web-based experiments. Journal of Survey Statistics and Methodology, 6(3), 376–400. https://doi.org/10.1093/jssam/smx020
Schonlau, M., & Toepoel, V. (2015). Straightlining in web survey panels over time. Survey Research Methods, 9(2), 125–137. https://doi.org/10.18148/srm/2015.v9i2.6128
Toepoel, V., Das, M., & van Soest, A. (2009). Design of web questionnaires: The effects of the number of items per screen. Field Methods, 21(2), 200–213. https://doi.org/10.1177/1525822X08330261
Tourangeau, R., Couper, M. P., & Conrad, F. (2004). Spacing, position, and order: Interpretive heuristics for visual features of survey questions. Public Opinion Quarterly, 68(3), 368–393. https://doi.org/10.1093/poq/nfh035
Weijters, B., Baumgartner, H., & Schillewaert, N. (2013). Reversed item bias: An integrative model. Psychological Methods, 18(3), 320–334. https://doi.org/10.1037/a0032121
Zhang, C., & Conrad, F. G. (2014). Speeding in web surveys: The tendency to answer very fast and its association with straightlining. Survey Research Methods, 8(2), 127–135. https://doi.org/10.18148/srm/2014.v8i2.5453