
Surveys · Nonresponse, weighting and data quality
Satisficing in Surveys: Why Respondents Take Mental Shortcuts
Answering survey questions well takes effort, and many respondents do not give it. Satisficing theory explains when and how people take shortcuts, from agreeing with statements to giving the same answer to every item. This article explains the theory, the evidence, its consequences for data quality and how questionnaire design can reduce it.
Answering a survey question well is more demanding than it looks. The respondent must understand what is being asked, search memory for relevant information, combine that information into a judgement and then express the judgement using the response options provided (Tourangeau et al., 2000). Doing all of this carefully for dozens of questions takes real effort. Many respondents, at least some of the time, do not make that effort. They give answers that seem reasonable enough without doing the full work of answering.
Krosnick (1991) called this behaviour satisficing, borrowing a term coined by Simon (1956) to describe decision-makers who choose the first option that is good enough rather than searching for the best one. Satisficing theory has become one of the most influential frameworks for understanding the quality of survey answers. It explains a wide range of response patterns, including agreeing with statements regardless of content, choosing the first reasonable option, saying "don't know" and giving identical answers to a series of questions. This article explains the theory, reviews the evidence and sets out what questionnaire designers can do to reduce satisficing.
Optimising and satisficing
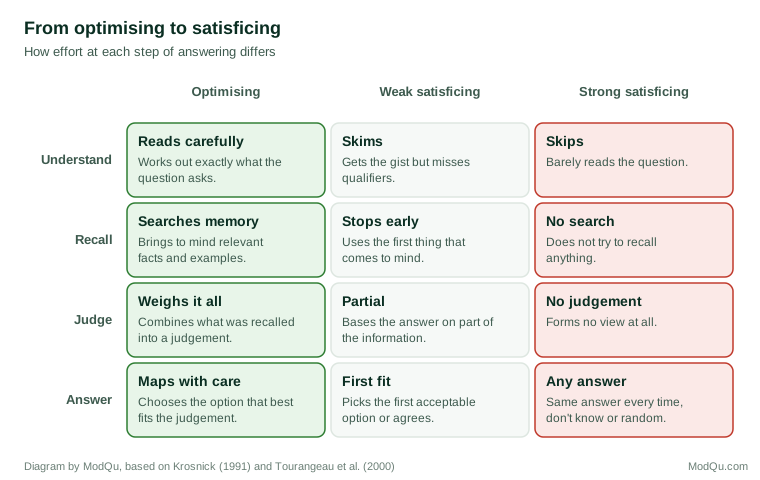
Krosnick (1991) contrasted satisficing with optimising, in which a respondent carries out each step of answering thoroughly. Optimising respondents read each question carefully, retrieve relevant information, integrate it into a judgement and select the response option that best represents that judgement. Satisficing respondents cut corners at one or more of these steps.
Krosnick distinguished two levels of satisficing. In weak satisficing, the respondent goes through all the steps but less thoroughly: they skim the question, accept the first relevant thought that comes to mind and pick the first acceptable option. In strong satisficing, the respondent skips the retrieval and judgement steps altogether and selects an answer that appears defensible without thinking about the question at all (Krosnick, 1991; Krosnick et al., 1996). Figure 1 shows how effort differs at each step.
Forms of satisficing
Satisficing theory predicts several distinct response patterns.
Weak satisficing
Response order effects. When answer options are read aloud, respondents who satisfice tend to choose options near the end of the list, because these are freshest in memory. When options are shown visually, satisficers tend to choose options near the top, because they select the first acceptable one. These are called recency and primacy effects respectively (Krosnick & Alwin, 1987). Malhotra (2008) found that primacy effects in web surveys were concentrated among respondents who completed the questionnaire quickly and had less education, consistent with satisficing.
Acquiescence. Satisficing respondents may agree with statements because agreeing is easier than thinking of reasons to disagree. This produces a tendency to say "agree" or "yes" regardless of what the statement says (Krosnick, 1991). Acquiescence is especially common with agree–disagree questions and among respondents with less education or lower cognitive ability (Narayan & Krosnick, 1996).
Strong satisficing
Saying "don't know" or "no opinion". Offering an explicit "don't know" option gives satisficers an easy way out. Krosnick et al. (2002) found that "no opinion" options attracted respondents who would otherwise have given meaningful answers, and that offering them did not improve the quality of the data. Many people who choose "no opinion" do hold views but do not want to do the work of reporting them.
Non-differentiation and straightlining. When asked to rate a series of items on the same scale, satisficers often give the same or similar answers to all of them. This is called non-differentiation; its extreme form, identical answers to every item in a grid, is called straightlining (Krosnick, 1991; Kim et al., 2019).
Endorsing the status quo. When a question asks whether to change something, saying "keep things as they are" requires less thought than considering alternatives (Krosnick, 1991).
Random or mental coin-flipping. At the extreme, a respondent may choose answers at random. This is difficult to distinguish from genuine variation and is often detected through inconsistencies between related answers.
When people satisfice
Krosnick (1991) proposed that the likelihood of satisficing depends on three factors.
Task difficulty. Questions that are long, complex, abstract or about unfamiliar topics are harder to answer, which increases satisficing. Difficult wording, many response options and questions requiring recall of distant events all raise the effort needed to optimise.
Respondent ability. People with greater cognitive skills and more experience thinking about the topic find it easier to optimise. Studies have consistently found more satisficing among respondents with less education (Narayan & Krosnick, 1996; Krosnick, 1999).
Respondent motivation. People who are interested in the topic, believe the survey is important, feel accountable for their answers or are not yet tired are more likely to optimise. Motivation falls as a questionnaire goes on (Krosnick, 1991).
The three factors interact. A difficult question may be answered well by a motivated, knowledgeable respondent but poorly by one who is tired or unfamiliar with the topic. An easy question may be answered well even by a respondent with little interest. This interaction explains why the same questionnaire can produce good data from one group and poor data from another, and why satisficing tends to cluster in particular sections of a survey and among particular respondents. It also means that designers have two broad levers: they can lower the difficulty of the task, and they can raise motivation, for example by explaining why the survey matters or by placing interesting questions early. Ability is largely outside the designer's control, but clear wording reduces the demands placed on it.
The theory states that satisficing becomes more likely as difficulty increases and as ability and motivation decrease. Roberts et al. (2019) reviewed studies testing these predictions and found broad support, although the strength of the evidence varied across forms of satisficing and many studies relied on indirect indicators.
Evidence on satisficing
Questionnaire length and fatigue
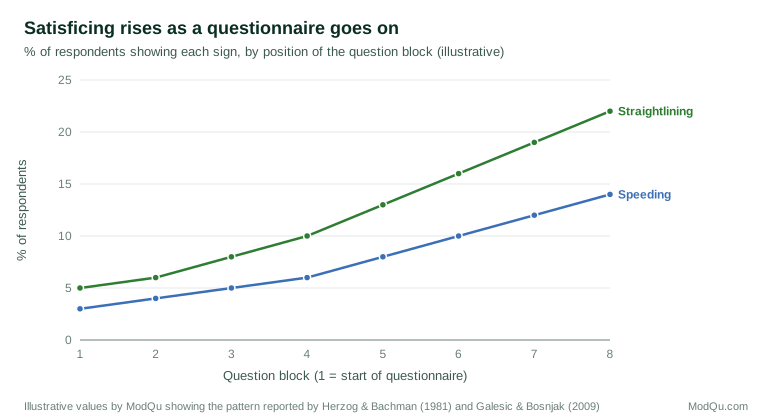
Long questionnaires give respondents more opportunity to tire. Herzog and Bachman (1981) found that responses to questions later in a long questionnaire showed more straightlining and more identical answers than responses to the same kinds of questions earlier. Galesic and Bosnjak (2009) experimentally varied the announced length of a web survey and the position of question blocks, and found that answers to questions placed later were shorter and less differentiated. Figure 2 illustrates the general pattern.
Survey mode
The mode of data collection can affect satisficing. Holbrook et al. (2003) compared telephone and face-to-face interviews with long questionnaires and found more satisficing in telephone interviews, including more non-differentiation and more "no opinion" answers. They attributed this to lower engagement and the faster pace of telephone conversations. Chang and Krosnick (2009) found that internet respondents from probability-based panels showed less satisficing than telephone respondents, possibly because they could answer at their own pace.
In web surveys, the absence of an interviewer removes one source of motivation. Respondents can move quickly, and some do so without reading. Zhang and Conrad (2014) found that respondents who answered very quickly, called speeders, were more likely to straightline. Anduiza and Galais (2017) found that a substantial share of respondents to online surveys failed checks that required reading instructions, which they interpreted as strong satisficing.
Question format
Grids, which present several items with the same response scale in a table, are efficient but encourage non-differentiation. Couper et al. (2013) found that grid design affected straightlining and missing data, and Revilla and Couper (2018) found that presenting items one at a time could reduce straightlining compared with grids, particularly on smartphones. Agree–disagree formats invite acquiescence, and questions asking respondents to compare many items can lead to satisficing through primacy or simplification (Krosnick & Presser, 2010).
Why satisficing matters
Satisficing reduces the quality of survey knowledge in several ways.
Biased estimates. Acquiescence inflates agreement with whatever statement is presented. Primacy and recency effects shift answers towards particular options. "Don't know" answers remove respondents whose views differ systematically from others. Each distorts estimates of what the population thinks or does.
Weaker relationships. Non-differentiation flattens differences between items. If a respondent rates every brand the same, the survey cannot detect which brands they prefer. Random answering adds noise that weakens correlations between variables, so that real relationships are underestimated.
Group differences that reflect effort, not views. Because satisficing varies with education, age and motivation, comparisons between groups can partly reflect differences in effort. A group that appears to agree more with a set of statements may simply acquiesce more (Narayan & Krosnick, 1996).
Misleading trends. If the conditions that encourage satisficing change over time, such as a shift from interviewer-administered to self-administered modes, apparent trends may reflect changes in satisficing rather than in the population.
Reducing satisficing through design
Satisficing theory suggests that designers can reduce it by making questions easier to answer, by increasing respondents' motivation and by avoiding formats that make shortcuts easy (Krosnick, 1991; Krosnick & Presser, 2010).
Make the task easier
- Write simple, specific questions. Use familiar words and concrete reference periods. Break complex questions into simpler parts.
- Limit the number of response options to what respondents can distinguish, and label each scale point clearly (Krosnick & Fabrigar, 1997).
- Avoid agree–disagree formats. Questions that ask directly about the dimension of interest, such as "How satisfied are you…?", reduce acquiescence compared with asking whether respondents agree with a statement (Krosnick & Presser, 2010).
Keep respondents motivated
- Keep questionnaires short. Remove questions that are not needed. Place the most important questions early, before fatigue sets in (Galesic & Bosnjak, 2009).
- Explain the importance of careful answers. Statements about the value of accurate answers, or requests for commitment, can increase effort. Cannell et al. (1981) found that asking respondents to commit to answering carefully and giving feedback during interviews improved the accuracy of reports.
- Make the survey engaging. Varied question types and clear progress information can help sustain attention, although designs that add burden can have the opposite effect.
Avoid formats that invite shortcuts
- Use grids sparingly, keep them short, or present items one at a time, especially on mobile devices (Revilla & Couper, 2018).
- Randomise or rotate the order of response options in lists, so that order effects average out across respondents rather than biasing results (Krosnick & Alwin, 1987).
- Think carefully about "don't know" options. For factual knowledge questions they may be appropriate, but for attitude questions, omitting an explicit "no opinion" option and allowing respondents to skip if they wish often yields better data (Krosnick et al., 2002).
Detecting satisficing in data
Even with good design, some respondents satisfice. Indicators can help identify them (Meade & Craig, 2012; Kim et al., 2019):
- Completion time. Very fast completion, relative to the length of the questionnaire, suggests that questions were not read.
- Straightlining and low variation across items in grids.
- Attention checks, such as instructions that ask respondents to choose a particular answer (Oppenheimer et al., 2009).
- Inconsistent answers to related questions, or answers to reversed items that contradict each other.
- Very short or meaningless answers to open questions.
Removing respondents flagged by these indicators can improve data quality but can also bias the sample, because satisficing is more common in some groups. Excluding them may remove less educated or younger respondents disproportionately. A common approach is to use several indicators together, to flag rather than delete where possible, and to check whether results change when flagged cases are excluded (Anduiza & Galais, 2017; Roberts et al., 2019).
Satisficing on mobile devices
A growing share of online survey responses come from smartphones. Small screens, touch input and frequent interruptions might be expected to increase satisficing, and some studies have found differences, particularly for grids, which are hard to display on a small screen. Others have found that well-designed mobile questionnaires produce data of similar quality to those completed on computers (Tourangeau et al., 2018). The difference lies mostly in design. Questions shown one at a time, response options large enough to tap, and short open questions that do not demand long typing reduce the extra burden of a small screen (Revilla & Couper, 2018). Designers should test questionnaires on the devices respondents actually use rather than assuming that a layout built for a large screen will work everywhere.
The role of interviewers
In interviewer-administered surveys, the interviewer can either reduce or encourage satisficing. A skilled interviewer sets a steady pace, reads each question fully and probes when an answer seems hasty. Cannell et al. (1981) showed that interviewer instructions and feedback that emphasised careful answering improved reporting. On the other hand, interviewers under pressure to complete many interviews may speed up, skip introductions or accept quick answers, which signals to respondents that effort is not expected. Holbrook et al. (2003) linked the higher satisficing in telephone interviews partly to the faster pace of telephone conversation. Training and monitoring that reward careful interviewing rather than speed help keep respondents engaged.
Satisficing in business surveys
Business and professional respondents satisfice too. A manager asked to rate twenty suppliers on ten attributes may give similar ratings to all of them, and an employee completing a survey on behalf of an organisation may choose answers that seem safe rather than retrieve accurate figures from records. The conditions are familiar: a long questionnaire, a busy respondent and a task with little personal benefit. Keeping business questionnaires short, asking for information that respondents have to hand, allowing estimates where exact figures are not available and explaining how the results will be used all help. When a question requires data from records, telling respondents in advance which records they will need lets them prepare rather than guess.
Is satisficing always a problem?
Not every quick or simple answer is a sign of poor quality. Some respondents give identical ratings because they genuinely feel the same about every item, and some choose "don't know" because they really do not know. Treating all such answers as satisficing would remove valid data and could bias results against people with less strongly differentiated views (Roberts et al., 2019). Researchers should therefore interpret indicators of satisficing with care, using several together and considering whether a pattern makes sense for the questions concerned. A straight line of "very satisfied" answers from a loyal customer may be accurate; a straight line of middle answers across items that include reversed statements is more likely to reflect a lack of effort.
Satisficing and other response effects
Satisficing is not the only reason survey answers depart from the truth. Social desirability bias arises when respondents shape answers to present themselves favourably, which requires effort rather than avoiding it. Mindlessness, in which respondents answer automatically because of habit or inattention, overlaps with strong satisficing but has different psychological roots (Vannette & Krosnick, 2014). Distinguishing these processes helps choose the right remedy: social desirability calls for privacy and self-administration, whereas satisficing calls for simpler questions and greater motivation (Holbrook et al., 2003).
An example
A customer experience survey asks 40 rating questions, arranged in five grids of eight items each, with a five-point agree–disagree scale. Analysis shows that 18 per cent of respondents gave identical answers to every item in the last two grids, compared with 6 per cent in the first grid, and that median completion time on the last two grids is half that on the first.
The team redesigns the survey. It removes 12 questions that were rarely used in reporting, replaces agree–disagree items with direct questions using item-specific response scales, splits grids into shorter sets of four items and presents items one at a time on mobile devices. The most important questions are moved to the beginning. In the redesigned survey, straightlining in the final section falls to 7 per cent, median completion time falls by a quarter and differences between items become larger and more consistent with other measures of customer behaviour (illustrative example).
Conclusion
Satisficing is a natural response to the effort that survey questions demand. Respondents with less ability or motivation, facing difficult questions late in a long questionnaire, are most likely to take shortcuts: agreeing, choosing the first option, saying "don't know" or giving the same answer repeatedly. These shortcuts bias estimates, weaken relationships and can create false differences between groups. Questionnaire designers can reduce satisficing by writing simpler questions, keeping surveys short, avoiding formats that invite shortcuts and helping respondents understand why careful answers matter. Recognising satisficing as a predictable consequence of design, rather than simply a failing of respondents, leads to better survey knowledge.
References
Anduiza, E., & Galais, C. (2017). Answering without reading: IMCs and strong satisficing in online surveys. International Journal of Public Opinion Research, 29(3), 497–519. https://doi.org/10.1093/ijpor/edw007
Cannell, C. F., Miller, P. V., & Oksenberg, L. (1981). Research on interviewing techniques. Sociological Methodology, 12, 389–437. https://doi.org/10.2307/270748
Chang, L., & Krosnick, J. A. (2009). National surveys via RDD telephone interviewing versus the internet: Comparing sample representativeness and response quality. Public Opinion Quarterly, 73(4), 641–678. https://doi.org/10.1093/poq/nfp075
Couper, M. P., Tourangeau, R., Conrad, F. G., & Zhang, C. (2013). The design of grids in web surveys. Social Science Computer Review, 31(3), 322–345. https://doi.org/10.1177/0894439312469865
Galesic, M., & Bosnjak, M. (2009). Effects of questionnaire length on participation and indicators of response quality in a web survey. Public Opinion Quarterly, 73(2), 349–360. https://doi.org/10.1093/poq/nfp031
Herzog, A. R., & Bachman, J. G. (1981). Effects of questionnaire length on response quality. Public Opinion Quarterly, 45(4), 549–559. https://doi.org/10.1086/268687
Holbrook, A. L., Green, M. C., & Krosnick, J. A. (2003). Telephone versus face-to-face interviewing of national probability samples with long questionnaires: Comparisons of respondent satisficing and social desirability response bias. Public Opinion Quarterly, 67(1), 79–125. https://doi.org/10.1086/346010
Kim, Y., Dykema, J., Stevenson, J., Black, P., & Moberg, D. P. (2019). Straightlining: Overview of measurement, comparison of indicators, and effects in mail–web mixed-mode surveys. Social Science Computer Review, 37(2), 214–233. https://doi.org/10.1177/0894439317752406
Krosnick, J. A., & Alwin, D. F. (1987). An evaluation of a cognitive theory of response-order effects in survey measurement. Public Opinion Quarterly, 51(2), 201–219. https://doi.org/10.1086/269029
Krosnick, J. A., & Fabrigar, L. R. (1997). Designing rating scales for effective measurement in surveys. In L. Lyberg, P. Biemer, M. Collins, E. de Leeuw, C. Dippo, N. Schwarz, & D. Trewin (Eds.), Survey measurement and process quality (pp. 141–164). Wiley. https://doi.org/10.1002/9781118490013.ch6
Krosnick, J. A., & Presser, S. (2010). Question and questionnaire design. In P. V. Marsden & J. D. Wright (Eds.), Handbook of survey research (2nd ed., pp. 263–313). Emerald.
Krosnick, J. A. (1991). Response strategies for coping with the cognitive demands of attitude measures in surveys. Applied Cognitive Psychology, 5(3), 213–236. https://doi.org/10.1002/acp.2350050305
Krosnick, J. A. (1999). Survey research. Annual Review of Psychology, 50, 537–567. https://doi.org/10.1146/annurev.psych.50.1.537
Krosnick, J. A., Holbrook, A. L., Berent, M. K., Carson, R. T., Hanemann, W. M., Kopp, R. J., Mitchell, R. C., Presser, S., Ruud, P. A., Smith, V. K., Moody, W. R., Green, M. C., & Conaway, M. (2002). The impact of "no opinion" response options on data quality: Non-attitude reduction or an invitation to satisfice? Public Opinion Quarterly, 66(3), 371–403. https://doi.org/10.1086/341394
Krosnick, J. A., Narayan, S., & Smith, W. R. (1996). Satisficing in surveys: Initial evidence. New Directions for Evaluation, 1996(70), 29–44. https://doi.org/10.1002/ev.1033
Malhotra, N. (2008). Completion time and response order effects in web surveys. Public Opinion Quarterly, 72(5), 914–934. https://doi.org/10.1093/poq/nfn050
Meade, A. W., & Craig, S. B. (2012). Identifying careless responses in survey data. Psychological Methods, 17(3), 437–455. https://doi.org/10.1037/a0028085
Narayan, S., & Krosnick, J. A. (1996). Education moderates some response effects in attitude measurement. Public Opinion Quarterly, 60(1), 58–88. https://doi.org/10.1086/297739
Oppenheimer, D. M., Meyvis, T., & Davidenko, N. (2009). Instructional manipulation checks: Detecting satisficing to increase statistical power. Journal of Experimental Social Psychology, 45(4), 867–872. https://doi.org/10.1016/j.jesp.2009.03.009
Revilla, M., & Couper, M. P. (2018). Comparing grids with vertical and horizontal item-by-item formats for PCs and smartphones. Social Science Computer Review, 36(3), 349–368. https://doi.org/10.1177/0894439317715626
Roberts, C., Gilbert, E., Allum, N., & Eisner, L. (2019). Research synthesis: Satisficing in surveys: A systematic review of the literature. Public Opinion Quarterly, 83(3), 598–626. https://doi.org/10.1093/poq/nfz035
Simon, H. A. (1956). Rational choice and the structure of the environment. Psychological Review, 63(2), 129–138. https://doi.org/10.1037/h0042769
Tourangeau, R., Rips, L. J., & Rasinski, K. (2000). The psychology of survey response. Cambridge University Press. https://doi.org/10.1017/CBO9780511819322
Tourangeau, R., Sun, H., Yan, T., Maitland, A., Rivero, G., & Williams, D. (2018). Web surveys by smartphones and tablets: Effects on data quality. Social Science Computer Review, 36(5), 542–556. https://doi.org/10.1177/0894439317719438
Vannette, D. L., & Krosnick, J. A. (2014). Answering questions: A comparison of survey satisficing and mindlessness. In A. Ie, C. T. Ngnoumen, & E. J. Langer (Eds.), The Wiley Blackwell handbook of mindfulness (pp. 312–327). Wiley. https://doi.org/10.1002/9781118294895.ch17
Zhang, C., & Conrad, F. G. (2014). Speeding in web surveys: The tendency to answer very fast and its association with straightlining. Survey Research Methods, 8(2), 127–135. https://doi.org/10.18148/srm/2014.v8i2.5453