
Surveys · Types and applications
Pricing Surveys: Van Westendorp, Gabor-Granger and Conjoint Approaches
Surveys are widely used to estimate what customers will pay for a product. This article compares three common approaches, the Van Westendorp price sensitivity meter, the Gabor-Granger method and conjoint analysis, and explains the strengths and limits of each.
Setting a price is one of the most consequential decisions a business makes, and surveys are a common way to estimate how customers will respond to different prices. Asking people directly what they would pay tends to produce unreliable answers, so researchers have developed structured methods that ask about price in more indirect ways (Breidert et al., 2006). Three are widely used.
Van Westendorp price sensitivity meter
The price sensitivity meter, introduced by Van Westendorp (1976), asks four questions about a product:
- At what price would it be so cheap that you would doubt its quality?
- At what price would it be a bargain?
- At what price would it start to seem expensive?
- At what price would it be so expensive that you would not consider buying it?
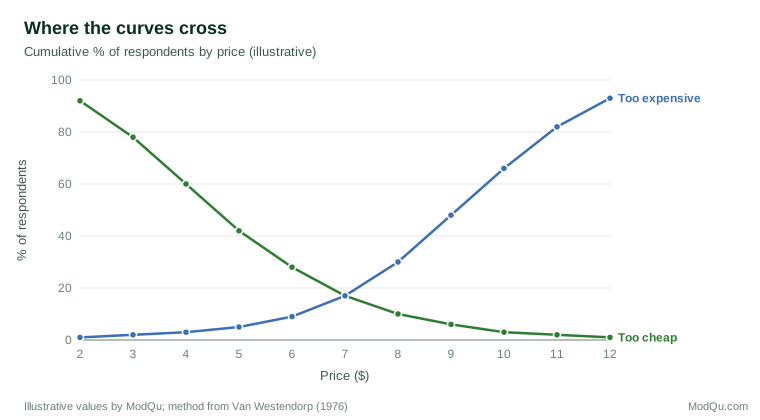
The cumulative share of respondents giving each answer is plotted against price. The points where the curves cross define a range of acceptable prices. For example, the point where the "too cheap" and "too expensive" curves cross is often called the optimal price point, as shown in Figure 1. The method is quick and shows how customers perceive price, but it does not measure whether they would actually buy, and it says nothing about competing products.
Gabor-Granger method
The Gabor-Granger method shows respondents a product at a series of prices and asks, at each price, whether they would buy it (Gabor & Granger, 1966). Prices are often presented in a sequence that moves up after a "yes" and down after a "no". The share willing to buy at each price gives a demand curve, and multiplying demand by price shows which price maximises revenue. The method is simple and gives a direct estimate of demand, but respondents may overstate their willingness to buy, and seeing the product alone, without competitors, makes the task unlike a real purchase.
Conjoint analysis
Conjoint analysis asks respondents to choose between products that vary in several features, one of which is price (Green & Srinivasan, 1990). Because price is traded off against features and brands, respondents cannot simply focus on it, and the results show how much each feature is worth in money terms. Choice-based versions, which include competing products and an option to buy none of them, come closest to real purchase decisions. Conjoint studies take longer to design and analyse, and need larger samples, than the other two methods.
Which method is most accurate?
Studies comparing survey estimates with real purchases suggest that all direct survey methods tend to overstate what people will pay, because respondents do not spend real money. Miller et al. (2011) compared several approaches against actual purchases and found that choice-based conjoint and open questions both overstated willingness to pay, but that methods with real economic consequences, in which respondents might actually have to buy at the price they state, were more accurate. Wertenbroch and Skiera (2002) showed how such incentive-compatible methods can be used at the point of purchase. Survey results are therefore best treated as relative guides, useful for comparing prices and products, rather than as exact forecasts.
An example
A software company plans a new subscription service. A Van Westendorp survey suggests that most customers find prices between $6 and $9 a month acceptable. A Gabor-Granger test of $6, $7, $8 and $9 shows that revenue peaks at $8. A conjoint study then shows that adding a family plan is worth more to customers than a lower price (illustrative example).
Practical guidance
- Use the Van Westendorp method early, to find a plausible price range for a new product.
- Use Gabor-Granger to test a few specific prices for a product whose features are settled.
- Use conjoint when price must be weighed against features, brands and competitors.
- Describe the product clearly, and in conjoint studies include realistic competitors.
- Treat the results as relative and, where possible, check them against market tests.
Conclusion
Pricing surveys give companies evidence on how customers respond to price before a product reaches the market. Each method answers a different question, and none removes the tendency of respondents to overstate what they would pay. Choosing the method that matches the decision, and interpreting results with that bias in mind, makes pricing research useful.
References
Breidert, C., Hahsler, M., & Reutterer, T. (2006). A review of methods for measuring willingness-to-pay. Innovative Marketing, 2(4), 8–32.
Gabor, A., & Granger, C. W. J. (1966). Price as an indicator of quality: Report on an enquiry. Economica, 33(129), 43–70. https://doi.org/10.2307/2552272
Green, P. E., & Srinivasan, V. (1990). Conjoint analysis in marketing: New developments with implications for research and practice. Journal of Marketing, 54(4), 3–19. https://doi.org/10.1177/002224299005400402
Miller, K. M., Hofstetter, R., Krohmer, H., & Zhang, Z. J. (2011). How should consumers' willingness to pay be measured? An empirical comparison of state-of-the-art approaches. Journal of Marketing Research, 48(1), 172–184. https://doi.org/10.1509/jmkr.48.1.172
Van Westendorp, P. H. (1976). NSS price sensitivity meter (PSM): A new approach to study consumer perception of prices. In Proceedings of the 29th ESOMAR Congress (pp. 139–167). ESOMAR.
Wertenbroch, K., & Skiera, B. (2002). Measuring consumers' willingness to pay at the point of purchase. Journal of Marketing Research, 39(2), 228–241. https://doi.org/10.1509/jmkr.39.2.228.19086