
Surveys · Nonresponse, weighting and data quality
Mixed-Mode Survey Administration: Harmonizing Data for Cohesive Knowledge
Many surveys now combine web, paper, telephone and face-to-face data collection to improve coverage and response at lower cost. This article explains the main mixed-mode designs, the trade-offs they involve, how to design questions that work across modes and how to analyse mixed-mode data so that results form a coherent whole.
For much of the twentieth century, most surveys used a single mode: face-to-face interviews, telephone interviews or mailed questionnaires. Today, single-mode surveys are increasingly the exception. Falling response rates, rising costs and uneven access to the internet have pushed survey organisations to combine modes, offering web questionnaires to those who will use them and paper, telephone or face-to-face alternatives to others (de Leeuw, 2005; Couper, 2011; Olson et al., 2021).
Mixed-mode designs can reach more of the population, raise response rates and reduce costs. They also create a new challenge. The same question asked in different modes can produce different answers, and the people who respond in each mode are different. If these differences are not managed, the combined data may describe a population that does not exist, or show changes over time that reflect shifts in mode rather than in the population (de Leeuw, 2018; Hox et al., 2017). This article explains the main mixed-mode designs, the trade-offs they involve, how to design questionnaires that work across modes and how to analyse the resulting data.
Why mix modes?
Every mode has strengths and weaknesses for coverage, response, measurement and cost (de Leeuw, 2005; Tourangeau, 2017).
- Face-to-face interviews reach almost everyone with an address and achieve relatively high response, but are very expensive.
- Telephone interviews are cheaper but now achieve low response and miss people who screen calls.
- Paper questionnaires sent by mail reach nearly every address and produce good response among older people, but data entry is slow and complex routing is difficult.
- Web questionnaires are cheap, fast and private, and allow complex designs, but exclude people without internet access or the skills to use it, and response to web-only requests is often low.
Mixing modes allows a survey to use each mode where it works best. A cheap mode can be used first, with more expensive modes reserved for those who do not respond, so that cost falls while coverage and response are maintained (Dillman et al., 2014).
Types of mixed-mode design
Mixed-mode designs vary in how and when modes are combined. Figure 1 summarises four main types (de Leeuw, 2005; Dillman et al., 2014).
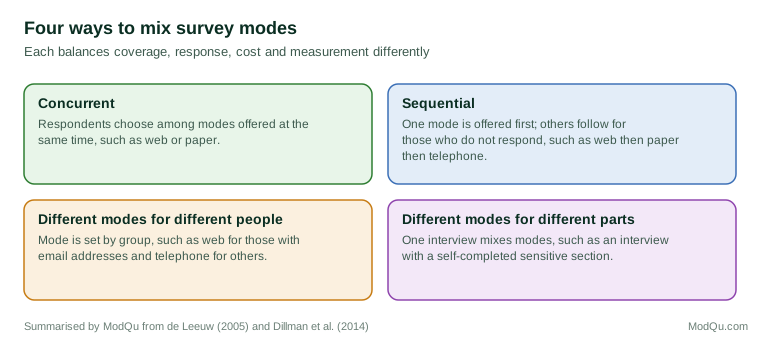
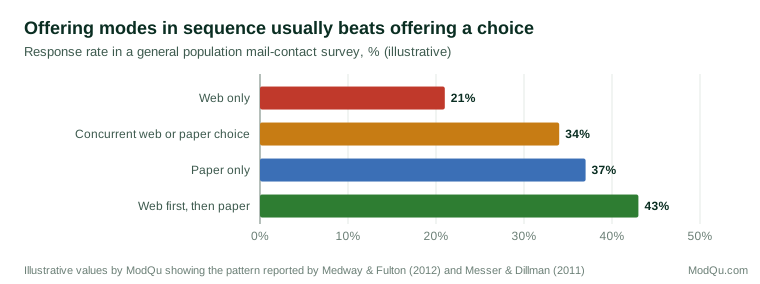
Concurrent designs offer respondents a choice of modes at the same time. A letter might include both a paper questionnaire and a web address. Intuitively, offering a choice should increase response. In practice, it often does not. Medway and Fulton (2012) conducted a meta-analysis of experiments and found that offering a web option alongside a paper questionnaire slightly reduced response rates compared with paper alone. Choice appears to add a decision that some people postpone indefinitely. Olson, Smyth and Wood (2012) found that even offering people their own preferred mode did not consistently increase participation.
Sequential designs offer one mode first and others later to those who have not responded. A common example is the web-push design: an initial letter invites a web response, and later mailings add a paper questionnaire. Messer and Dillman (2011) found that web-push designs could obtain a large share of responses online while achieving overall response rates close to those of paper-only surveys. Millar and Dillman (2011) found that sequential designs encouraging web response first, with incentives, produced good response rates and high web uptake. Figure 2 illustrates the general pattern.
Different modes for different people assign modes according to what is known about each sample member, for example web for people with known email addresses and telephone or face-to-face for others. Longitudinal surveys often use this approach, offering web to members who have previously responded online and interviewers to others (Lynn, 2013; Bianchi et al., 2017).
Different modes for different parts of the interview combine modes within a single interview. The most common example is a face-to-face interview in which sensitive questions are self-administered on a computer or tablet, to reduce social desirability bias (Tourangeau & Smith, 1996).
The trade-off: selection and measurement
Mixing modes affects survey error in two ways that pull in different directions (Vannieuwenhuyze et al., 2010; Tourangeau, 2017).
Selection effects are usually the reason for mixing. Different kinds of people respond in different modes: younger, more educated people tend to respond online; older people more often respond on paper or by telephone. Adding modes brings in people who would not respond in a single mode, which improves coverage and can reduce nonresponse bias.
Measurement effects are the cost. The same person may give different answers in different modes because of differences in interviewer presence, visual or aural presentation, pace and privacy. Interviewer-administered modes tend to produce more positive ratings and fewer reports of sensitive behaviour than self-administered modes (Kreuter et al., 2008; Ye et al., 2011). Visual and aural modes produce different response order effects. These differences mean that answers from different modes cannot simply be pooled without checking.
The challenge is that the two effects are confounded. When web respondents give lower satisfaction ratings than telephone respondents, the difference may arise because web respondents are less satisfied (selection) or because the web elicits lower ratings (measurement), or both. Separating the two is one of the central problems of mixed-mode research (Jäckle et al., 2010; Schouten et al., 2013).
Designing questionnaires for mixed modes
The first line of defence against measurement differences is questionnaire design. Two broad approaches exist.
Unified mode design
Unified mode design, also called unimode design, aims to present questions in a way that is as similar as possible across modes, so that respondents receive the same stimulus whatever the mode (Dillman et al., 2014). Its principles include:
- Same wording and response options in every mode. Avoid adding a "don't know" option in one mode but not another, or reading only some options aloud.
- Short response lists that can be read aloud and remembered in telephone interviews.
- Fully labelled scales, which work in both visual and aural modes, rather than scales labelled only at the ends.
- Avoiding check-all-that-apply questions, which work differently in visual and aural modes; ask a yes/no question for each item instead (Smyth et al., 2006).
- Consistent instructions and definitions, given in the question text rather than in visual aids that cannot be reproduced by telephone.
Mode-specific design
A mode-specific approach accepts that each mode has its own strengths and designs each version to measure the concept as well as possible in that mode, even if the presentation differs. This can produce better measurement within each mode but makes it harder to know whether differences between modes reflect the population or the design (de Leeuw, 2018). Many surveys adopt a combination: unified design for most questions, with mode-specific adaptations where a unified version would harm measurement in one mode.
Visual design in self-administered modes
Even between two self-administered modes, such as web and paper, visual design can produce differences. The layout of response scales, the spacing of options and the use of symbols and graphics affect answers (Christian et al., 2009; Tourangeau et al., 2013). Keeping layouts as similar as possible across web and paper versions reduces these effects.
Analysing mixed-mode data
When data are collected in several modes, analysts need to decide whether and how to adjust for measurement differences.
Testing for mode effects
The most direct evidence comes from experiments in which respondents are randomly assigned to modes. Because assignment is random, differences between modes reflect measurement rather than selection (Jäckle et al., 2010). Embedding such experiments in a mixed-mode survey, even for a subsample, provides valuable information for later analysis.
Without experiments, analysts can compare respondents in different modes after adjusting for characteristics that affect mode choice. If differences remain after adjustment, they may reflect measurement effects, but they may also reflect unmeasured selection differences (Vannieuwenhuyze et al., 2010).
Separating selection and measurement
Several methods attempt to separate selection and measurement effects statistically. One uses a reference sample interviewed in a single mode with high response as a benchmark, and compares it with the mixed-mode results (Vannieuwenhuyze et al., 2010). Another models the choice of mode using background variables and assumes that, given those variables, mode choice is unrelated to the answers (Schouten et al., 2013). Klausch et al. (2013) tested the equivalence of attitude questions across modes using measurement models and found that some questions were comparable across modes while others were not. These methods depend on assumptions that cannot be fully checked, so their results should be treated as approximations.
Adjusting for measurement effects
When measurement effects are estimated, results can be adjusted to a single benchmark mode. Buelens and van den Brakel (2015) proposed calibrating mixed-mode survey estimates so that the share of responses from each mode is held constant over time, which prevents changes in the mode mix from appearing as changes in the estimates. This approach is especially useful for repeated surveys where the share of web responses rises from year to year.
Reporting
Whatever approach is used, reports should describe the modes used, the share of responses from each and any adjustments made. Users can then judge whether comparisons over time or between groups might be affected by mode (Hox et al., 2017).
Mixed modes in longitudinal surveys
Panels that follow the same people over time face particular issues. Moving members from interviewer-administered modes to the web can reduce costs substantially, but it may change measurement for continuing members and increase attrition among those less comfortable online. Lynn (2013) compared sequential mixed-mode designs in a panel and found that web-first designs reduced costs but could increase attrition and change sample composition unless follow-up in other modes was strong. Bianchi et al. (2017) found that introducing a web-first option in a household panel produced cost savings with limited effects on participation when face-to-face follow-up was retained. For panels, mode changes should be introduced experimentally where possible, so that their effects on measurement and retention can be measured.
Costs and fieldwork management
Cost is often the main reason for mixing modes, but the savings depend on the design. Web responses have low marginal costs, while interviewer-administered follow-up is expensive per completed case. In a sequential design, every respondent who answers online in the first phase is a case that does not need a more expensive follow-up. Mailed reminders, paper questionnaires and interviewer visits are then concentrated on the cases that remain. Studies of web-push designs show that the cost per completed questionnaire can fall substantially compared with single-mode interviewer designs, although the savings are smaller where printing, postage and data entry for paper questionnaires remain large (Dillman et al., 2014; Tourangeau, 2017).
Mixed modes also add costs that single-mode surveys do not have. Each mode needs its own instrument, testing, fieldwork systems and quality checks. Contact materials must explain the options clearly, and case management systems must track which cases have responded in which mode, so that people who have already answered are not contacted again. Mode switching creates duplicate responses that must be detected and resolved. These fixed costs are worthwhile for large or repeated surveys but can outweigh the savings for small, one-off studies (de Leeuw, 2005; Couper, 2011).
Devices within the web mode
The web mode is itself mixed. Respondents answer on desktop computers, laptops, tablets and smartphones, and the share using smartphones has grown steadily. Screen size, touch input and the settings in which people answer differ between devices. Smartphone respondents tend to take longer, break off more often in long questionnaires and give shorter answers to open questions, although differences in substantive answers to well-designed closed questions are usually small (Couper, 2011; Tourangeau et al., 2013). A web questionnaire that will be part of a mixed-mode design should therefore be designed for small screens from the start, avoiding large grids and long horizontal scales. Recording the device used for each response allows analysts to check for device effects in the same way as for mode effects.
Mixed modes in business surveys
Surveys of businesses and other organisations have used mixed modes for longer than most household surveys. Questionnaires are often completed by staff who consult records, may need several sittings and may involve more than one person. Paper forms, web forms, telephone follow-up and, increasingly, direct electronic data transfer from accounting systems are combined. The main challenges differ from those in household surveys: questions often ask for figures rather than opinions, so measurement differences arise less from social desirability than from differences in how definitions, instructions and help are presented in each mode. Consistent definitions and the same instructions in each mode are especially important, as is allowing respondents to save and return to web forms (Dillman et al., 2014).
Practical guidance
For researchers planning a mixed-mode survey, several practical steps follow from the evidence:
- Start by deciding what matters most for the survey's purpose: coverage, response, cost, comparability with earlier data or the accuracy of sensitive measures.
- Choose the order of modes with these priorities in mind. For general population surveys contacted by mail, offering the web first and paper later usually produces a better balance of response and cost than offering both at once (Medway & Fulton, 2012; Messer & Dillman, 2011).
- Write one questionnaire and adapt it carefully for each mode, rather than writing separate questionnaires.
- Test each version with respondents who will use that mode, including on smartphones.
- Plan the analysis in advance, including how mode will be recorded, whether experiments will be embedded and how estimates will be adjusted.
- Report the design, response by mode and any adjustments so that users can judge the comparability of the results.
Harmonising knowledge across modes
The goal of mixed-mode research is not merely to collect data in several ways but to produce cohesive knowledge: estimates that can be interpreted as describing one population at one time, and trends that reflect real change. Several principles support this goal (de Leeuw, 2018; Dillman et al., 2014; Hox et al., 2017):
- Plan the mix in advance, deciding which modes will be used, in what order and for whom, rather than adding modes in response to falling response.
- Design for comparability, using unified mode principles for core questions and testing all versions with respondents in each mode.
- Keep the mode mix stable in repeated surveys, or calibrate estimates to a fixed mix, so that trends are not distorted.
- Build in experiments, randomly assigning a subsample to modes, to estimate measurement effects.
- Record the mode of each response and any switches between modes, so that analysts can check for differences.
- Document and report modes, shares and adjustments.
An example
A national agency runs an annual survey of household energy use, historically by telephone. To reduce cost and improve coverage of households without landlines, it moves to a sequential design: letters invite a web response, a paper questionnaire follows for nonrespondents, and a telephone follow-up is used for a subsample of remaining nonrespondents. Questions are revised using unified mode principles: all scales are fully labelled, check-all lists are replaced with yes/no items and the same wording is used in all modes.
In the first year, a random tenth of the sample is assigned to the old telephone design, providing an experimental comparison. Overall response rises from 18 to 36 per cent. The web and paper responses show lower satisfaction with energy suppliers and higher reported difficulties paying bills than the telephone sample, even after weighting for demographic differences. The agency uses the experimental subsample to estimate measurement effects, publishes a bridged series showing the trend on both bases and calibrates future estimates to a fixed mode mix (illustrative example).
Conclusion
Mixed-mode designs have become central to survey research because no single mode now offers good coverage, high response and low cost together. Concurrent, sequential and other mixed designs each balance these factors differently, and sequential web-push designs have proved especially effective for general population surveys contacted by mail. The cost of mixing is the risk that measurement differs between modes, confounded with differences in who responds in each. Unified question design, embedded experiments, careful analysis and transparent reporting allow researchers to combine data from different modes into cohesive, comparable knowledge.
References
Bianchi, A., Biffignandi, S., & Lynn, P. (2017). Web-face-to-face mixed-mode design in a longitudinal survey: Effects on participation rates, sample composition, and costs. Journal of Official Statistics, 33(2), 385–408. https://doi.org/10.1515/jos-2017-0019
Buelens, B., & van den Brakel, J. A. (2015). Measurement error calibration in mixed-mode sample surveys. Sociological Methods & Research, 44(3), 391–426. https://doi.org/10.1177/0049124114532444
Christian, L. M., Parsons, N. L., & Dillman, D. A. (2009). Designing scalar questions for web surveys. Sociological Methods & Research, 37(3), 393–425. https://doi.org/10.1177/0049124108330004
Couper, M. P. (2011). The future of modes of data collection. Public Opinion Quarterly, 75(5), 889–908. https://doi.org/10.1093/poq/nfr046
de Leeuw, E. D. (2005). To mix or not to mix data collection modes in surveys. Journal of Official Statistics, 21(2), 233–255.
de Leeuw, E. D. (2018). Mixed-mode: Past, present, and future. Survey Research Methods, 12(2), 75–89. https://doi.org/10.18148/srm/2018.v12i2.7402
Dillman, D. A., Smyth, J. D., & Christian, L. M. (2014). Internet, phone, mail, and mixed-mode surveys: The tailored design method (4th ed.). Wiley.
Hox, J., de Leeuw, E., & Klausch, T. (2017). Mixed-mode research: Issues in design and analysis. In P. P. Biemer, E. de Leeuw, S. Eckman, B. Edwards, F. Kreuter, L. E. Lyberg, N. C. Tucker, & B. T. West (Eds.), Total survey error in practice (pp. 511–530). Wiley. https://doi.org/10.1002/9781119041702.ch23
Jäckle, A., Roberts, C., & Lynn, P. (2010). Assessing the effect of data collection mode on measurement. International Statistical Review, 78(1), 3–20. https://doi.org/10.1111/j.1751-5823.2010.00102.x
Klausch, T., Hox, J. J., & Schouten, B. (2013). Measurement effects of survey mode on the equivalence of attitudinal rating scale questions. Sociological Methods & Research, 42(3), 227–263. https://doi.org/10.1177/0049124113500480
Kreuter, F., Presser, S., & Tourangeau, R. (2008). Social desirability bias in CATI, IVR, and web surveys: The effects of mode and question sensitivity. Public Opinion Quarterly, 72(5), 847–865. https://doi.org/10.1093/poq/nfn063
Lynn, P. (2013). Alternative sequential mixed-mode designs: Effects on attrition rates, attrition bias, and costs. Journal of Survey Statistics and Methodology, 1(2), 183–205. https://doi.org/10.1093/jssam/smt015
Medway, R. L., & Fulton, J. (2012). When more gets you less: A meta-analysis of the effect of concurrent web options on mail survey response rates. Public Opinion Quarterly, 76(4), 733–746. https://doi.org/10.1093/poq/nfs047
Messer, B. L., & Dillman, D. A. (2011). Surveying the general public over the internet using address-based sampling and mail contact procedures. Public Opinion Quarterly, 75(3), 429–457. https://doi.org/10.1093/poq/nfr021
Millar, M. M., & Dillman, D. A. (2011). Improving response to web and mixed-mode surveys. Public Opinion Quarterly, 75(2), 249–269. https://doi.org/10.1093/poq/nfr003
Olson, K., Smyth, J. D., & Wood, H. M. (2012). Does giving people their preferred survey mode actually increase survey participation rates? An experimental examination. Public Opinion Quarterly, 76(4), 611–635. https://doi.org/10.1093/poq/nfs024
Olson, K., Smyth, J. D., Horwitz, R., Keeter, S., Lesser, V., Marken, S., Mathiowetz, N. A., McCarthy, J. S., O'Brien, E., Opsomer, J. D., Steiger, D., Sterrett, D., Su, J., Suzer-Gurtekin, Z. T., Turakhia, C., & Wagner, J. (2021). Transitions from telephone surveys to self-administered and mixed-mode surveys: AAPOR task force report. Journal of Survey Statistics and Methodology, 9(3), 381–411. https://doi.org/10.1093/jssam/smz062
Schouten, B., van den Brakel, J., Buelens, B., van der Laan, J., & Klausch, T. (2013). Disentangling mode-specific selection and measurement bias in social surveys. Social Science Research, 42(6), 1555–1570. https://doi.org/10.1016/j.ssresearch.2013.07.005
Smyth, J. D., Dillman, D. A., Christian, L. M., & Stern, M. J. (2006). Comparing check-all and forced-choice question formats in web surveys. Public Opinion Quarterly, 70(1), 66–77. https://doi.org/10.1093/poq/nfj007
Tourangeau, R., & Smith, T. W. (1996). Asking sensitive questions: The impact of data collection mode, question format, and question context. Public Opinion Quarterly, 60(2), 275–304. https://doi.org/10.1086/297751
Tourangeau, R. (2017). Mixing modes: Tradeoffs among coverage, nonresponse, and measurement error. In P. P. Biemer, E. de Leeuw, S. Eckman, B. Edwards, F. Kreuter, L. E. Lyberg, N. C. Tucker, & B. T. West (Eds.), Total survey error in practice (pp. 115–132). Wiley. https://doi.org/10.1002/9781119041702.ch6
Tourangeau, R., Conrad, F. G., & Couper, M. P. (2013). The science of web surveys. Oxford University Press. https://doi.org/10.1093/acprof:oso/9780199747047.001.0001
Vannieuwenhuyze, J., Loosveldt, G., & Molenberghs, G. (2010). A method for evaluating mode effects in mixed-mode surveys. Public Opinion Quarterly, 74(5), 1027–1045. https://doi.org/10.1093/poq/nfq059
Ye, C., Fulton, J., & Tourangeau, R. (2011). More positive or more extreme? A meta-analysis of mode differences in response choice. Public Opinion Quarterly, 75(2), 349–365. https://doi.org/10.1093/poq/nfr009