
Surveys · Questionnaire design
Matrix Sampling Designs for Reducing Respondent Burden While Preserving Knowledge Scope
Matrix sampling, also called a split questionnaire design, gives each respondent only part of a long questionnaire while the full set of questions is still answered across the sample. This article explains how the designs work, how missing answers are handled in analysis and when the approach is worth using.
Every survey faces a conflict between what researchers want to know and what respondents are willing to give. Long questionnaires collect more information, but they also tire respondents, lower the quality of answers near the end and discourage people from taking part at all (Galesic & Bosnjak, 2009). One solution is to ask fewer questions. Another is matrix sampling: the full questionnaire is divided into parts, and each respondent answers only some of them. Across the whole sample every question is answered by enough people, so the scope of the study is kept while the burden on each person is reduced (Raghunathan & Grizzle, 1995).
This article explains where the idea came from, how the main designs are built, what happens to the missing answers during analysis and what researchers should consider before using the approach.
Origins in educational testing
Matrix sampling began in educational measurement. Test developers wanted to estimate how well a whole population of students performed on a large pool of items, without making each student sit every item. Lord (1962) showed that population norms could be estimated by giving different random subsets of items to different random subsets of students. The approach was developed further for programme evaluation and assessment, where the aim was a population estimate rather than a score for each individual (Shoemaker, 1973).
Large-scale international assessments still rely on the method. In programmes such as the Programme for International Student Assessment (PISA), each student completes only a few clusters of test items, arranged in a rotated booklet design, but the clusters are combined so that the full item pool is covered in every country (OECD, 2017). Statistical methods were developed to estimate population characteristics from these sparse patterns of responses (Mislevy et al., 1992).
From tests to questionnaires
Survey researchers later applied the same reasoning to questionnaires. Raghunathan and Grizzle (1995) proposed the split questionnaire design, in which the questions are grouped into components and each respondent receives a selection of components. The missing components are then filled in statistically, using the relationships between the questions that are observed in the parts of the sample that answered them. The authors showed that this produced estimates close to those from a full questionnaire while reducing the length of each interview.
Psychologists arrived at a similar idea under the name planned missing data designs (Graham et al., 2006). The word "planned" is important. Most missing data in surveys arise because respondents skip questions or stop answering, for reasons the researcher does not control. In a matrix design, the researcher decides in advance which questions are missing for whom, usually at random. Because the missingness is created by the design and does not depend on the respondents' answers, it does not cause the bias that unplanned missing data often does (Schafer & Graham, 2002).
How the designs are built
The three-form design
The simplest and most widely used version is the three-form design (Graham et al., 2006). The questions are divided into four blocks. Block X contains core questions that every respondent answers, such as key outcomes and demographic variables. Blocks A, B and C contain the remaining questions. Each version of the questionnaire, or form, contains Block X and two of the other three blocks, as shown in Figure 1.
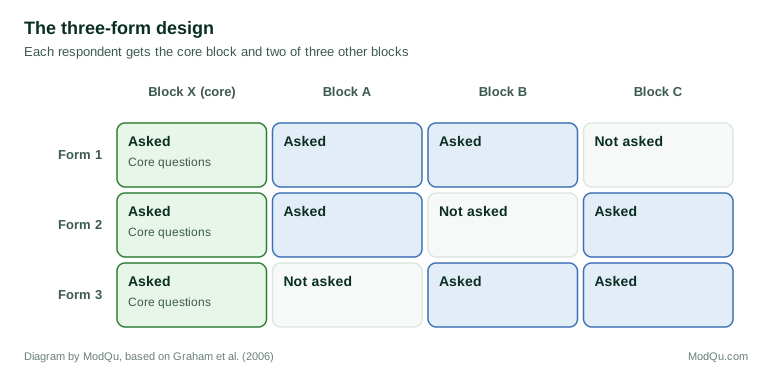
This arrangement has a useful property: every pair of blocks appears together on at least one form. As a result, the correlation between any two questions in the study can be estimated directly from the data, which is what later analysis requires. If the four blocks are of equal size, each respondent answers three quarters of the questionnaire, a reduction of 25 per cent.
Larger splits
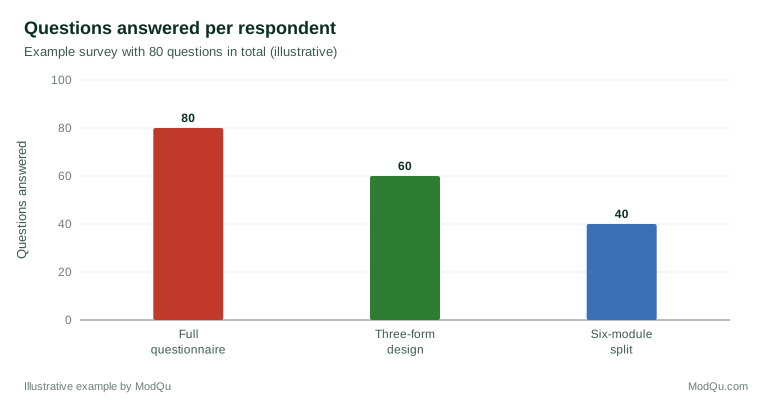
Greater savings are possible with more blocks. A survey can be divided into a core and six modules, with each respondent receiving the core and two modules. Each person then answers a much smaller share of the questions, but each pair of modules is answered together by fewer respondents, so the estimates of relationships between modules become less precise. Designs of this kind have been studied for very long marketing surveys, where the question was how to assign modules so that information lost by splitting is as small as possible (Adigüzel & Wedel, 2008).
Deciding which questions go together
How questions are assigned to blocks matters. Questions that are strongly related to each other help to predict each other's missing values, so a common recommendation is to spread related questions across different blocks rather than keep them all together. If a whole topic sits in one block, then for respondents who did not receive that block there is nothing in their data that predicts their answers on that topic. In an evaluation of split designs for online panel surveys, the way modules were constructed affected how well the missing answers could later be imputed (Axenfeld et al., 2022).
There are, however, practical limits. A questionnaire still has to make sense to the person answering it. Scattering items of one scale across different modules can produce a disjointed experience, and questions that depend on each other through skip logic must stay together. Designers therefore balance statistical efficiency against the flow of the questionnaire.
Analysing data with planned gaps
A matrix design leaves a dataset in which many cells are empty by design. Two main approaches are used to analyse it.
The first is multiple imputation. Each missing answer is replaced several times with plausible values drawn from a model based on the observed data, creating several complete datasets. Each dataset is analysed in the usual way, and the results are combined with rules that reflect the extra uncertainty caused by the missing information (Rubin, 1987). Modern software makes this routine, and the approach is described in detail in standard texts (van Buuren, 2018). In large-scale assessments, the equivalent values are known as plausible values (von Davier et al., 2009).
The second is full information maximum likelihood, which estimates the parameters of a model directly from all the available data without filling in the gaps (Enders, 2010). For many common models, such as regressions and structural equation models, it gives results similar to multiple imputation.
Both approaches rely on the assumption that the data are missing at random, meaning that whether a value is missing does not depend on the missing value itself once the observed data are taken into account (Little & Rubin, 2019). In a planned design with random assignment of forms, this assumption holds by construction, which is the main reason matrix sampling works well statistically. The assumption does not cover answers that respondents leave out themselves, so ordinary item nonresponse still needs attention.
What is gained and what is lost
Benefits
The first benefit is shorter questionnaires. Studies of questionnaire length show that respondents who face longer surveys are less likely to start or finish them and give lower quality answers towards the end (Herzog & Bachman, 1981; Galesic & Bosnjak, 2009). Splitting the questionnaire shortens each interview and therefore reduces these problems. The theory of satisficing explains why: as effort increases, respondents become more likely to give answers that are merely acceptable rather than accurate (Krosnick, 1991).
The second benefit is better data for the questions that are asked. Because respondents are less tired, the answers they do give may be more accurate. An experimental comparison found that a split questionnaire reduced measurement error that is associated with long surveys (Peytchev & Peytcheva, 2017).
The third benefit is scope. A study can cover more topics than any single respondent could reasonably answer, which is valuable when an organisation wants knowledge across a wide range of subjects.
Costs
The main cost is precision. Each question outside the core is answered by fewer people, so estimates for those questions have larger standard errors. The loss is often smaller than might be expected, because imputation recovers part of the information from related questions, but it is real (Raghunathan & Grizzle, 1995). Researchers therefore need larger samples than they would for a full questionnaire if they want the same precision for every item. Evaluations using health survey data found that the loss depended strongly on how well the missing items could be predicted from the observed ones (Thomas et al., 2006).
A second cost is complexity. Matrix designs require careful planning, programming of several questionnaire versions, and analysts who are comfortable with imputation or likelihood methods. Simple tabulations of the raw data are misleading because each item has a different set of respondents. Fieldwork staff also need to check that the forms are assigned correctly, since an error in the randomisation can make one block answered mostly by one type of respondent, which would undermine the assumption on which the analysis depends. Data documentation must record the design so that later users of the dataset understand why so many values are empty and do not delete those cases or treat the gaps as refusals.
A third cost concerns individual-level use. If a business wants to act on each respondent's full profile, for example to follow up with individual customers, matrix sampling is a poor fit, because each person's profile is incomplete. The method is designed for population estimates and for relationships between variables, not for individual scores.
An example
A retailer wants to learn about customers' views on price, product range, store layout, online ordering, delivery, customer service and sustainability. A full questionnaire would take about 25 minutes, and pilot testing shows that many respondents stop answering after 15 minutes. The research team keeps a core block of 5 minutes containing overall satisfaction, frequency of shopping and demographics. The remaining six topics are grouped into three blocks of about 6 minutes each, with related questions spread across blocks, and the three-form design is used. Each customer answers for about 17 minutes. After fieldwork, the team uses multiple imputation to create complete datasets and reports estimates for all seven topics, with somewhat wider confidence intervals for the non-core questions (illustrative example).
When to use matrix sampling
Matrix sampling is most useful when the following conditions are met:
- The questionnaire is too long for respondents to answer well in full.
- The goal is to estimate population figures or relationships, not to score individuals.
- The sample is large enough that each block is still answered by many respondents.
- Questions across blocks are related, so that missing answers can be predicted.
- The team has the skills to carry out imputation or likelihood-based analysis.
It is less suitable for small samples, for studies where every respondent's full answers are needed, and for questionnaires whose topics are unrelated, because imputation then has little to work with (Chipperfield & Steel, 2009).
Practical checklist
- Put the most important outcomes and all variables needed for weighting and analysis in the core block.
- Assign forms to respondents at random and record which form each person received.
- Make sure every pair of blocks is answered together by enough respondents.
- Spread strongly related questions across different blocks where the questionnaire flow allows it.
- Keep questions linked by routing in the same block.
- Plan the analysis before fieldwork, including the imputation model and the number of imputed datasets.
- Report clearly that a matrix design was used and how the missing data were handled.
Common problems
One common problem is treating the planned gaps as ordinary missing data and analysing only complete cases. In a matrix design almost no respondent has complete data, so this wastes most of the sample. Another is putting too little in the core block, which leaves the imputation model with weak predictors. A third is ignoring the respondent's experience: a questionnaire that jumps between unrelated topics to satisfy a statistical rule may itself increase burden and reduce data quality (Tourangeau et al., 2000).
Conclusion
Matrix sampling allows a survey to keep its full scope while asking each respondent fewer questions. Its foundations lie in educational testing, and it has been adapted for questionnaires as split questionnaire and planned missing data designs. Because the missing answers are created at random by the researcher, they can be handled with established methods such as multiple imputation without introducing bias. The cost is lower precision for non-core items and greater complexity in design and analysis. For long surveys with large samples and a focus on population knowledge, it is one of the most effective ways to reduce respondent burden without giving up the questions that matter.
References
Adigüzel, F., & Wedel, M. (2008). Split questionnaire design for massive surveys. Journal of Marketing Research, 45(5), 608–617. https://doi.org/10.1509/jmkr.45.5.608
Axenfeld, J. B., Blom, A. G., Bruch, C., & Wolf, C. (2022). Split questionnaire designs for online surveys: The impact of module construction on imputation quality. Journal of Survey Statistics and Methodology, 10(5), 1236–1262. https://doi.org/10.1093/jssam/smab055
Chipperfield, J. O., & Steel, D. G. (2009). Design and estimation for split questionnaire surveys. Journal of Official Statistics, 25(2), 227–244.
Enders, C. K. (2010). Applied missing data analysis. Guilford Press.
Galesic, M., & Bosnjak, M. (2009). Effects of questionnaire length on participation and indicators of response quality in a web survey. Public Opinion Quarterly, 73(2), 349–360. https://doi.org/10.1093/poq/nfp031
Graham, J. W., Taylor, B. J., Olchowski, A. E., & Cumsille, P. E. (2006). Planned missing data designs in psychological research. Psychological Methods, 11(4), 323–343. https://doi.org/10.1037/1082-989X.11.4.323
Herzog, A. R., & Bachman, J. G. (1981). Effects of questionnaire length on response quality. Public Opinion Quarterly, 45(4), 549–559. https://doi.org/10.1086/268687
Krosnick, J. A. (1991). Response strategies for coping with the cognitive demands of attitude measures in surveys. Applied Cognitive Psychology, 5(3), 213–236. https://doi.org/10.1002/acp.2350050305
Little, R. J. A., & Rubin, D. B. (2019). Statistical analysis with missing data (3rd ed.). Wiley. https://doi.org/10.1002/9781119482260
Lord, F. M. (1962). Estimating norms by item-sampling. Educational and Psychological Measurement, 22(2), 259–267. https://doi.org/10.1177/001316446202200202
Mislevy, R. J., Beaton, A. E., Kaplan, B., & Sheehan, K. M. (1992). Estimating population characteristics from sparse matrix samples of item responses. Journal of Educational Measurement, 29(2), 133–161. https://doi.org/10.1111/j.1745-3984.1992.tb00371.x
OECD. (2017). PISA 2015 technical report. OECD Publishing. https://www.oecd.org/pisa/data/2015-technical-report/
Peytchev, A., & Peytcheva, E. (2017). Reduction of measurement error due to survey length: Evaluation of the split questionnaire design approach. Survey Research Methods, 11(4), 361–368. https://doi.org/10.18148/srm/2017.v11i4.7145
Raghunathan, T. E., & Grizzle, J. E. (1995). A split questionnaire survey design. Journal of the American Statistical Association, 90(429), 54–63. https://doi.org/10.1080/01621459.1995.10476488
Rubin, D. B. (1987). Multiple imputation for nonresponse in surveys. Wiley. https://doi.org/10.1002/9780470316696
Schafer, J. L., & Graham, J. W. (2002). Missing data: Our view of the state of the art. Psychological Methods, 7(2), 147–177. https://doi.org/10.1037/1082-989X.7.2.147
Shoemaker, D. M. (1973). Principles and procedures of multiple matrix sampling. Ballinger.
Thomas, N., Raghunathan, T. E., Schenker, N., Katzoff, M. J., & Johnson, C. L. (2006). An evaluation of matrix sampling methods using data from the National Health and Nutrition Examination Survey. Survey Methodology, 32(2), 217–231.
Tourangeau, R., Rips, L. J., & Rasinski, K. (2000). The psychology of survey response. Cambridge University Press. https://doi.org/10.1017/CBO9780511819322
van Buuren, S. (2018). Flexible imputation of missing data (2nd ed.). CRC Press. https://doi.org/10.1201/9780429492259
von Davier, M., Gonzalez, E., & Mislevy, R. J. (2009). What are plausible values and why are they useful? IERI Monograph Series: Issues and Methodologies in Large-Scale Assessments, 2, 9–36.