
Surveys · Questionnaire design
The Use of Randomized Response Techniques for Sensitive Knowledge Elicitation
Randomized response techniques use chance to hide each respondent's answer to a sensitive question while still allowing the share of people with the sensitive characteristic to be estimated. This article explains how the main designs work, what the evidence shows and when to use them.
When people are asked directly whether they have used illegal drugs, cheated on taxes or committed an offence, many do not answer truthfully. Even with promises of confidentiality, the person asking can see the answer. Randomized response techniques remove this problem by design: a chance device, seen only by the respondent, decides whether they answer the sensitive question or give a predetermined answer. No one can tell from an individual answer what the respondent actually did, but because the probabilities of the chance device are known, the share of people with the sensitive characteristic can be estimated for the group as a whole.
The original design
Warner (1965) proposed the first randomized response design. Each respondent uses a spinner or similar device that points, with a known probability, to one of two statements: "I have used drugs in the past year" or "I have not used drugs in the past year". The respondent answers "true" or "false" to whichever statement the device selects, without revealing which one it was. Because the interviewer does not know which statement was answered, a "true" answer reveals nothing certain. With the known probability of each statement, the proportion of drug users in the sample can be calculated from the proportion of "true" answers.
Later designs
Several improvements followed. In the unrelated question design, the chance device decides whether the respondent answers the sensitive question or an innocuous one, such as "Were you born in April?", whose answer distribution is known (Greenberg et al., 1969). In the forced response design, the device either instructs the respondent to answer the sensitive question truthfully or to say "yes" or "no" regardless (Fox & Tracy, 1986).
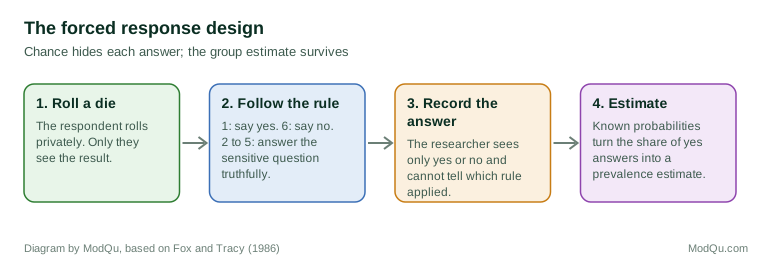
In the example in Figure 1, one sixth of respondents are forced to say "yes", one sixth to say "no" and four sixths answer truthfully. If 30 per cent of all answers are "yes", the estimated prevalence is (0.30 − 1/6) ÷ (4/6), or 20 per cent (illustrative figures).
More recently, the crosswise model asks respondents whether their answers to a sensitive question and an innocuous question are the same or different, so that no answer is directly linked to the sensitive item (Yu et al., 2008).
What the evidence shows
A meta-analysis of validation studies, in which the true status of respondents was known from records, found that randomized response produced more accurate estimates than direct questioning on average, although some respondents still did not answer truthfully (Lensvelt-Mulders et al., 2005). In a validation study using official records of a referendum vote, randomized response reduced bias more than a list experiment did (Rosenfeld et al., 2016).
The method also has weaknesses. Some respondents do not understand the procedure or do not trust that it protects them, and they may give the safe answer whatever the device shows (Landsheer et al., 1999). Experiments with online surveys have found that some implementations can even produce worse estimates than direct questions, which suggests that the design must be tested carefully (Höglinger et al., 2016).
Choosing the probabilities
Every randomized response design involves a trade-off. The more often the chance device forces an answer or points to the innocuous question, the better each respondent is protected, but the more noise enters the data and the less precise the estimate becomes. If the device almost always asks the sensitive question, precision improves, but respondents may feel exposed and stop answering truthfully. Designers therefore choose probabilities that respondents will see as protective while keeping the loss of precision acceptable. In the forced response design in Figure 1, a third of all answers are forced, which is a common middle ground (Fox & Tracy, 1986). Statistical work on these designs shows how the variance of the estimate grows as protection increases, and it allows researchers to calculate the sample size needed before fieldwork begins (Blair et al., 2015).
An example in business surveys
Suppose a company wants to know how many employees have seen colleagues break safety rules without reporting it. Asked directly, many staff will say "no" to avoid trouble for themselves or others. With a forced response design, each employee privately rolls a die and follows the rule in Figure 1. Management sees only the share of "yes" answers and the estimated prevalence for the workforce, never an individual's true answer. The estimate is less precise than a direct question would give, so the company needs a reasonably large number of respondents, and results for small teams cannot be reported. In online surveys the die can be replaced by a question whose answer only the respondent knows but whose distribution is known, such as the birth month of a family member, an approach used in tests of the crosswise model (Höglinger et al., 2016).
Costs and practical points
Because the chance device adds random noise, randomized response requires much larger samples than direct questioning to reach the same precision. The method estimates prevalence for groups, not for individuals, so it cannot be used to link sensitive behaviour to other characteristics of each respondent without specialised statistical models (Blair et al., 2015).
Practical guidance includes using a simple, transparent chance device that respondents can verify, explaining clearly how the procedure protects them and testing the procedure in a pilot. Randomized response is most useful when the behaviour is highly sensitive, the sample is large and the goal is an accurate estimate of how common the behaviour is (Tourangeau & Yan, 2007).
Conclusion
Randomized response techniques protect respondents by ensuring that no individual answer reveals sensitive information, while still allowing the group's prevalence to be estimated. They can reduce underreporting of sensitive behaviour, but they cost precision, depend on respondents' understanding and trust and need careful testing. Used where they fit, they are a valuable tool for producing knowledge about behaviour that people are reluctant to admit.
References
Blair, G., Imai, K., & Zhou, Y.-Y. (2015). Design and analysis of the randomized response technique. Journal of the American Statistical Association, 110(511), 1304–1319. https://doi.org/10.1080/01621459.2015.1050028
Fox, J. A., & Tracy, P. E. (1986). Randomized response: A method for sensitive surveys. SAGE. https://doi.org/10.4135/9781412985581
Greenberg, B. G., Abul-Ela, A.-L. A., Simmons, W. R., & Horvitz, D. G. (1969). The unrelated question randomized response model: Theoretical framework. Journal of the American Statistical Association, 64(326), 520–539. https://doi.org/10.1080/01621459.1969.10500991
Höglinger, M., Jann, B., & Diekmann, A. (2016). Sensitive questions in online surveys: An experimental evaluation of different implementations of the randomized response technique and the crosswise model. Survey Research Methods, 10(3), 171–187. https://doi.org/10.18148/srm/2016.v10i3.6703
Landsheer, J. A., van der Heijden, P. G. M., & van Gils, G. (1999). Trust and understanding, two psychological aspects of randomized response. Quality & Quantity, 33(1), 1–12. https://doi.org/10.1023/A:1004361819974
Lensvelt-Mulders, G. J. L. M., Hox, J. J., van der Heijden, P. G. M., & Maas, C. J. M. (2005). Meta-analysis of randomized response research: Thirty-five years of validation. Sociological Methods & Research, 33(3), 319–348.
Rosenfeld, B., Imai, K., & Shapiro, J. N. (2016). An empirical validation study of popular survey methodologies for sensitive questions. American Journal of Political Science, 60(3), 783–802. https://doi.org/10.1111/ajps.12205
Tourangeau, R., & Yan, T. (2007). Sensitive questions in surveys. Psychological Bulletin, 133(5), 859–883. https://doi.org/10.1037/0033-2909.133.5.859
Warner, S. L. (1965). Randomized response: A survey technique for eliminating evasive answer bias. Journal of the American Statistical Association, 60(309), 63–69. https://doi.org/10.1080/01621459.1965.10480775
Yu, J.-W., Tian, G.-L., & Tang, M.-L. (2008). Two new models for survey sampling with sensitive characteristic: Design and analysis. Metrika, 67(3), 251–263. https://doi.org/10.1007/s00184-007-0131-x