
Surveys · Questionnaire design
Item Response Theory Applications in Survey Instrument Calibration
Item response theory models how the probability of each answer depends on the trait a questionnaire measures and on the properties of each item. This article explains the main models, how items are calibrated, and how IRT helps build, shorten, compare and adapt survey scales.
Many surveys measure characteristics that cannot be observed directly, such as satisfaction, anxiety, trust, health or customer loyalty, by asking several related questions and combining the answers into a score. The usual approach adds up the answers, treating every item as equally informative. Item response theory (IRT) offers a more detailed approach. It models how each item behaves: how strongly it relates to the underlying trait and at what level of the trait it is most informative. With this information, items can be calibrated, scales can be built and shortened efficiently, scores can be compared across groups and versions and questionnaires can even adapt to each respondent.
This article explains the basic ideas of IRT, the main models, how items are calibrated and how IRT is applied in survey research.
From total scores to item models
Classical test theory
The traditional framework for scale construction, classical test theory, treats an observed score as the sum of a true score and random error. It provides useful statistics such as reliability coefficients and item-total correlations, and it underlies most scale development in practice (DeVellis, 2017). But its statistics depend on the sample: an item's difficulty and a scale's reliability can differ from one population to another, and the precision of measurement is assumed to be the same for everyone.
The IRT approach
IRT models the probability of each response to each item as a function of the respondent's level of the underlying trait, usually written as theta (θ), and of characteristics of the item (Embretson & Reise, 2000; Hambleton et al., 1991). The trait and the item characteristics are placed on the same scale. This allows researchers to describe each item separately, to estimate how precisely the scale measures at each level of the trait and, under the model's assumptions, to obtain item characteristics that do not depend on the particular sample (Embretson, 1996).
The main models
The Rasch and one-parameter models
The simplest model, developed by the Danish mathematician Georg Rasch, describes each item by a single parameter, its difficulty or location: the level of the trait at which a respondent has a 50 per cent chance of agreeing or answering correctly (Rasch, 1960). The Rasch model has strong measurement properties, including the property that the total score contains all the information about a respondent's trait level, and it has its own tradition of application (Bond & Fox, 2015).
The two-parameter model
The two-parameter logistic model adds a discrimination parameter, which describes how sharply the probability of agreeing rises as the trait increases (Lord, 1980). A highly discriminating item separates respondents just below and just above its location very well; a weakly discriminating item changes slowly and provides less information.
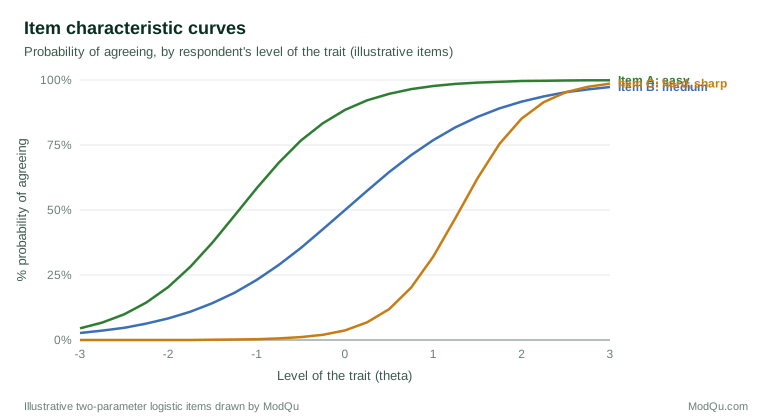
The curve relating the trait to the probability of a response is called the item characteristic curve. Figure 1 shows three items: an easy item that most respondents agree with, a medium item and a hard item that only respondents high on the trait endorse, which also discriminates sharply.
Models for rating scales
Most survey questions have more than two answer categories. Polytomous IRT models extend the approach to ordered categories such as Likert scales. The graded response model treats each boundary between categories as a separate threshold (Samejima, 1969). The partial credit model and the generalised partial credit model describe the probability of each category relative to the one before it (Masters, 1982; Muraki, 1992). These models describe not only how an item relates to the trait but also whether its categories are used as intended, for example whether respondents can distinguish between "agree" and "strongly agree".
Calibrating items
Calibration means estimating the parameters of each item from response data. It requires a sample of respondents who answer the items, typically several hundred or more, and software that fits the chosen model (Chalmers, 2012). The process usually involves several steps.
Checking assumptions
Standard IRT models assume unidimensionality, meaning that the items measure a single trait, and local independence, meaning that responses to items are related only through that trait. Factor analysis and residual correlations are used to check these assumptions. Items that measure a second trait, or pairs of items that are too similar, can distort the results (Reise et al., 2005).
Estimating and evaluating item parameters
Item parameters are estimated and examined. Items with low discrimination contribute little and are candidates for removal. Items whose categories are disordered, meaning that a higher category does not correspond to a higher trait level, may have too many categories or confusing labels. Fit statistics show whether each item behaves as the model expects.
Test and item information
A key concept in IRT is information, which measures how precisely an item or scale measures at each level of the trait. Information is highest near an item's location and is greater for more discriminating items. The information of a scale is the sum of the information of its items, and its inverse gives the standard error of measurement at each trait level (Baker, 2001).
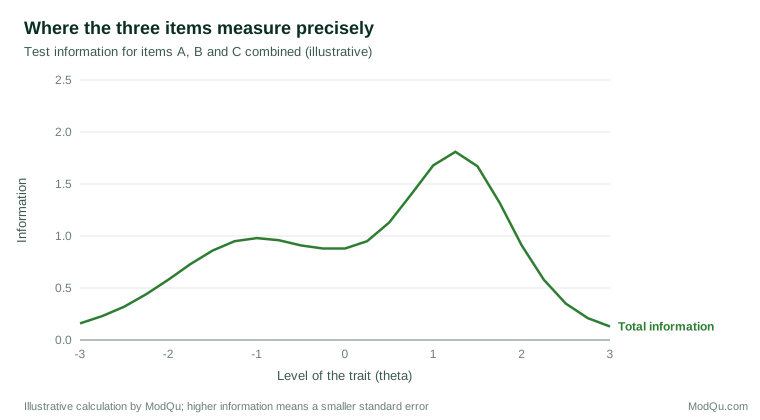
Unlike classical reliability, which gives a single number, information shows that a scale may measure some respondents precisely and others poorly. A satisfaction scale made of items that most customers agree with will distinguish well among dissatisfied customers but poorly among satisfied ones.
Multidimensional models
Some questionnaires measure several related traits, such as different aspects of job satisfaction. Multidimensional IRT models allow each item to relate to one or more traits and estimate the correlations between them. A common special case, the bifactor model, includes a general trait measured by all items and specific traits measured by subsets. Such models can show whether a total score is meaningful or whether separate subscale scores are needed (Reise et al., 2005; Chalmers, 2012).
An example: calibrating a satisfaction scale
Suppose a company has used a ten-item customer satisfaction scale, each item with five answer categories, for several years, and wants to shorten it. An IRT calibration on 2,000 recent responses might show the following (illustrative findings). Eight items fit a single dimension well, but two items about price form a separate cluster and are set aside for a separate measure. Among the eight, three items have high discrimination and are located around the middle of the trait, two are located at the high end and discriminate well among very satisfied customers, and the rest add little information. The categories "disagree" and "strongly disagree" are rarely used and barely distinguished, suggesting that a four-category scale would work as well.
On this evidence, the company could build a five-item short form that keeps the most informative items, including those at the high end where the business most needs to distinguish customers, and check that its information function stays close to that of the full scale across the range that matters. Because the items have been calibrated, scores from the short form can be placed on the same scale as historical scores from the full form, preserving the time series.
Applications in survey research
Building and shortening scales
IRT helps designers choose items that cover the full range of the trait and provide information where it is needed. When a long scale must be shortened, IRT shows which items contribute most information at the levels of interest, so that a short form can retain as much precision as possible (Embretson & Reise, 2000).
Item banks
An item bank is a large set of calibrated items measuring the same trait. Because all items are on the same scale, any subset can be used to produce comparable scores. The best-known example is the Patient-Reported Outcomes Measurement Information System (PROMIS), funded by the United States National Institutes of Health, which calibrated large banks of items for health outcomes such as fatigue, pain and depression (Reeve et al., 2007; Cella et al., 2010).
Adaptive questionnaires
With a calibrated item bank, a questionnaire can adapt to each respondent. In computerised adaptive testing, each next item is chosen to be most informative given the respondent's answers so far. Respondents answer fewer items, but their scores are about as precise as those from the full bank (Wainer, 2000). PROMIS instruments are commonly administered in this way (Cella et al., 2010).
Comparing groups and versions
IRT provides tools for detecting differential item functioning: items that behave differently for different groups of respondents with the same trait level, for example because of translation or cultural differences (Holland & Wainer, 1993). Removing or adjusting such items makes comparisons between groups fairer. Marketing researchers have used IRT and related methods to test whether consumer scales measure the same thing across countries (Steenkamp & Baumgartner, 1998) and to model differences in response styles across countries (de Jong et al., 2008).
IRT also supports linking and equating, which place scores from different versions of a questionnaire on a common scale. This allows results to be compared when items are changed, added or translated (Kolen & Brennan, 2014).
IRT and classical methods compared
Classical test theory and IRT are complementary rather than competing. Classical statistics are easy to compute and understand, need smaller samples and are often sufficient for a quick check of a new scale. IRT offers item-level detail, precision that varies with the trait level, tools for linking and adaptive measurement and a framework for testing whether items work the same way in different groups. In practice, scale developers commonly use classical analyses and factor analysis first, then IRT for final calibration and for the decisions that depend on item-level information (DeVellis, 2017; Embretson & Reise, 2000).
Practical considerations
IRT has costs and limitations. It requires larger samples than classical methods, especially for complex models and many categories. Its assumptions, particularly unidimensionality, may not hold for broad constructs. The software and expertise required are more specialised. And IRT scores, being estimates on a latent scale, are less intuitive to non-specialists than simple sums, so results often need to be translated back into familiar terms.
For many survey purposes, classical methods remain adequate. IRT is most valuable when scales will be used repeatedly, compared across groups or versions, shortened or administered adaptively, and when precision at particular trait levels matters.
In business surveys
Businesses use multi-item scales to measure customer satisfaction, brand perceptions, employee engagement and service quality. IRT can improve these scales in several ways. It can show which items carry the most information, so that long questionnaires can be shortened without losing precision. It can reveal answer categories that respondents do not distinguish, so that scales can be simplified. It can test whether a scale works in the same way in different markets or languages before results are compared. And it can show whether a scale distinguishes among the customers the business cares most about, for example among highly satisfied customers who are at risk of switching. For organisations that run the same surveys over many years, calibrating items once and maintaining a bank of tested items can make measurement both shorter and more consistent (de Ayala, 2009).
Conclusion
Item response theory treats each survey item as a measurement instrument with its own properties, rather than an interchangeable part of a total score. By modelling how responses depend on the underlying trait, IRT calibrates items, shows where a scale measures well or poorly, supports short forms, item banks and adaptive questionnaires and helps to make comparisons across groups and versions fair. It requires more data and expertise than classical methods, but for scales that matter, it offers a more precise and transparent basis for survey measurement.
References
Baker, F. B. (2001). The basics of item response theory (2nd ed.). ERIC Clearinghouse on Assessment and Evaluation.
Bond, T. G., & Fox, C. M. (2015). Applying the Rasch model: Fundamental measurement in the human sciences (3rd ed.). Routledge.
Cella, D., Riley, W., Stone, A., Rothrock, N., Reeve, B., Yount, S., Amtmann, D., Bode, R., Buysse, D., Choi, S., Cook, K., DeVellis, R., DeWalt, D., Fries, J. F., Gershon, R., Hahn, E. A., Lai, J.-S., Pilkonis, P., Revicki, D., … Hays, R. (2010). The Patient-Reported Outcomes Measurement Information System (PROMIS) developed and tested its first wave of adult self-reported health outcome item banks: 2005–2008. Journal of Clinical Epidemiology, 63(11), 1179–1194. https://doi.org/10.1016/j.jclinepi.2010.04.011
Chalmers, R. P. (2012). mirt: A multidimensional item response theory package for the R environment. Journal of Statistical Software, 48(6), 1–29. https://doi.org/10.18637/jss.v048.i06
de Ayala, R. J. (2009). The theory and practice of item response theory. Guilford Press.
de Jong, M. G., Steenkamp, J.-B. E. M., Fox, J.-P., & Baumgartner, H. (2008). Using item response theory to measure extreme response style in marketing research: A global investigation. Journal of Marketing Research, 45(1), 104–115. https://doi.org/10.1509/jmkr.45.1.104
DeVellis, R. F. (2017). Scale development: Theory and applications (4th ed.). SAGE.
Embretson, S. E., & Reise, S. P. (2000). Item response theory for psychologists. Lawrence Erlbaum.
Embretson, S. E. (1996). The new rules of measurement. Psychological Assessment, 8(4), 341–349. https://doi.org/10.1037/1040-3590.8.4.341
Hambleton, R. K., Swaminathan, H., & Rogers, H. J. (1991). Fundamentals of item response theory. SAGE.
Holland, P. W., & Wainer, H. (Eds.). (1993). Differential item functioning. Lawrence Erlbaum.
Kolen, M. J., & Brennan, R. L. (2014). Test equating, scaling, and linking: Methods and practices (3rd ed.). Springer. https://doi.org/10.1007/978-1-4939-0317-7
Lord, F. M. (1980). Applications of item response theory to practical testing problems. Lawrence Erlbaum.
Masters, G. N. (1982). A Rasch model for partial credit scoring. Psychometrika, 47(2), 149–174. https://doi.org/10.1007/BF02296272
Muraki, E. (1992). A generalized partial credit model: Application of an EM algorithm. Applied Psychological Measurement, 16(2), 159–176. https://doi.org/10.1177/014662169201600206
Rasch, G. (1960). Probabilistic models for some intelligence and attainment tests. Danish Institute for Educational Research.
Reeve, B. B., Hays, R. D., Bjorner, J. B., Cook, K. F., Crane, P. K., Teresi, J. A., Thissen, D., Revicki, D. A., Weiss, D. J., Hambleton, R. K., Liu, H., Gershon, R., Reise, S. P., Lai, J.-S., & Cella, D. (2007). Psychometric evaluation and calibration of health-related quality of life item banks: Plans for the Patient-Reported Outcomes Measurement Information System (PROMIS). Medical Care, 45(5 Suppl. 1), S22–S31. https://doi.org/10.1097/01.mlr.0000250483.85507.04
Reise, S. P., Ainsworth, A. T., & Haviland, M. G. (2005). Item response theory: Fundamentals, applications, and promise in psychological research. Current Directions in Psychological Science, 14(2), 95–101. https://doi.org/10.1111/j.0963-7214.2005.00342.x
Samejima, F. (1969). Estimation of latent ability using a response pattern of graded scores. Psychometrika Monograph Supplement, 34(4, Pt. 2), No. 17.
Steenkamp, J.-B. E. M., & Baumgartner, H. (1998). Assessing measurement invariance in cross-national consumer research. Journal of Consumer Research, 25(1), 78–90. https://doi.org/10.1086/209528
Wainer, H. (Ed.). (2000). Computerized adaptive testing: A primer (2nd ed.). Lawrence Erlbaum.