
Surveys · Questionnaire design
The Use of Vignette Experiments Within Surveys for Contextualized Knowledge
Vignette experiments ask respondents to judge short descriptions of people or situations whose features are varied at random. This article explains the factorial survey and related designs, what they can reveal that direct questions cannot, and how to design, analyse and interpret them.
Ask people directly whether a job applicant's age should affect a hiring decision, and most will say no. Ask them instead to rate several applicants, described in short paragraphs, whose age, qualifications and experience vary, and a different picture may emerge: older applicants may be rated lower even when everything else is equal. This is the logic of the vignette experiment. Instead of asking people what principles they follow, it asks them to make concrete judgements about specific cases and infers the principles from the pattern of their answers.
Vignette experiments place questions in context. They describe realistic situations with several features at once, as real decisions do, and vary those features systematically so that the influence of each can be measured. This article explains how vignette experiments work, what they reveal, how to design and analyse them and what their limits are.
What a vignette experiment is
A vignette is a short description of a person, object or situation. Vignettes have long been used in surveys to make abstract questions concrete (Alexander & Becker, 1978; Finch, 1987). A vignette experiment goes further: it varies the content of the vignettes at random across respondents, so that the effect of each feature can be estimated.
The most developed form is the factorial survey, introduced by the sociologist Peter Rossi to study social judgements such as the perceived fairness of earnings or the seriousness of crimes (Rossi & Anderson, 1982). In a factorial survey, each vignette is built from a set of dimensions, such as the age, sex and occupation of a person described, each with several levels. Combining the levels of all dimensions gives the vignette universe: every possible vignette. Each respondent rates a sample of vignettes drawn from this universe.
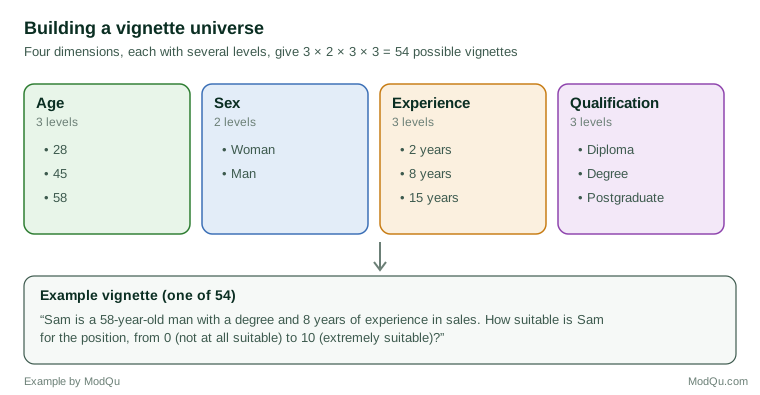
Because the levels are assigned at random and independently, the dimensions are uncorrelated across the vignettes. This allows the effect of each dimension on judgements to be estimated separately, something that is almost impossible with observational data, where characteristics such as age and experience go together (Jasso, 2006; Auspurg & Hinz, 2015).
Why use vignette experiments?
Measuring the weight of each factor
Many judgements involve weighing several considerations at once. A vignette experiment shows how much weight respondents give to each. In a classic application, respondents rated the fairness of the earnings of hypothetical workers whose sex, occupation, education and actual earnings varied. The results showed what respondents considered just earnings and whether they applied different standards to men and women (Jasso & Webster, 1997).
Reducing social desirability
Because each respondent sees several vignettes that vary on many dimensions, the purpose of the study is less obvious than in a direct question. Respondents who would not admit that they judge people differently by sex or ethnicity may still do so in their ratings without being aware of it. This makes vignette experiments useful for studying sensitive topics, although it does not remove social desirability entirely (Auspurg et al., 2015).
Context and realism
Real decisions are made about specific people and situations, not abstract categories. Vignettes describe situations in enough detail to be realistic, which can make judgements more meaningful than answers to general questions (Atzmüller & Steiner, 2010).
Combining experiments with surveys
When vignettes are included in surveys of the general population, the experiment's internal validity is combined with the survey's ability to represent a population. Researchers can also study how judgements differ between groups of respondents, for example whether older respondents weigh age differently from younger ones (Mutz, 2011; Wallander, 2009).
Related designs
Conjoint analysis
In conjoint analysis, used widely in market research, respondents evaluate or choose between product profiles that vary on attributes such as price, brand and features. The method estimates the value respondents place on each attribute and has been used for decades to design products and set prices (Green & Srinivasan, 1990). Choice-based conjoint, in which respondents choose between two or more profiles, draws on models of how people make choices between alternatives (Louviere et al., 2000). Political scientists have adapted conjoint designs to study voters' preferences between candidates and immigrants, and developed methods for estimating the causal effect of each attribute (Hainmueller et al., 2014).
Single-factor vignette experiments
Many survey experiments use vignettes that vary only one feature, such as the ethnicity of a person described, while keeping everything else constant. These are simpler to design and analyse but can test only one factor at a time. Political scientists have used such experiments widely to study attitudes on race, policy and candidates (Sniderman & Grob, 1996).
Designing a vignette experiment
Careful design is essential, because the quality of the results depends on how well the vignettes represent the judgements of interest. Several guides set out good practice (Atzmüller & Steiner, 2010; Aguinis & Bradley, 2014; Auspurg & Hinz, 2015).
Choose dimensions and levels
The dimensions should be those that theory or prior research suggests are important, and the levels should cover a realistic range. Too few dimensions make the vignettes unrealistic and may leave out important influences; too many make vignettes long and hard to process. Studies commonly use between four and eight dimensions.
Avoid implausible combinations
Random combination of levels can produce vignettes that make no sense, such as a 22-year-old surgeon with 30 years of experience. Implausible vignettes may confuse respondents or lead them to stop taking the task seriously. Such combinations can be excluded from the vignette universe, although this introduces some correlation between dimensions that must be accounted for in analysis.
Select the vignettes
When the vignette universe is large, not every vignette can be used. Researchers can select a random sample of vignettes or use an experimental design that chooses a subset so that the effects of interest can still be estimated efficiently. Fractional factorial designs, which choose vignettes to keep dimensions uncorrelated, are generally more efficient than random selection (Dülmer, 2007; Auspurg & Hinz, 2015).
Decide how many vignettes per respondent
Each respondent usually rates several vignettes, organised in decks. More vignettes per respondent give more information but increase burden and may lead to fatigue or simplified answering strategies. Research on general population samples found that older and less educated respondents took longer and answered less consistently, which argues for keeping the number of vignettes and dimensions moderate when the sample includes the whole population (Sauer et al., 2011). Ten vignettes per respondent is a common choice.
Mind the order of dimensions
The order in which dimensions are mentioned in the vignette text can influence how much attention they receive. Experiments found that dimensions mentioned first tend to have larger effects, so the order should be varied across respondents or fixed in a deliberate way (Auspurg & Jäckle, 2017).
Choose the response scale
Respondents may rate each vignette on a scale, such as fairness from 0 to 10, rank several vignettes or choose between them. Rating scales are common in factorial surveys; choices are standard in conjoint analysis. The choice should match the judgement being studied.
Pretest
Cognitive interviews and pilot tests should check that vignettes are understood as intended, that they seem realistic and that respondents can manage the number of vignettes asked.
Plan the sample size
The precision of the estimated effects depends on both the number of respondents and the number of vignettes each rates. Because ratings by the same respondent are correlated, adding vignettes per respondent increases precision less than adding respondents. Estimating differences between groups of respondents, such as whether men and women weigh a dimension differently, requires substantially larger samples than estimating the average effect of each dimension. Simulation before fieldwork, using plausible effect sizes, is a practical way to check whether a planned design can detect the effects of interest (Auspurg & Hinz, 2015).
Choose the mode
Vignette experiments are easiest to run in self-administered modes, especially online, where software can assign decks at random and present vignettes clearly. In interviewer surveys, vignettes can be shown on cards or on a screen. Reading long vignettes aloud by telephone is difficult, because respondents must hold all the information in memory, so telephone studies should use short vignettes with few dimensions.
Analysing vignette data
Each respondent rates several vignettes, so the data have a multilevel structure: vignettes nested within respondents. Ratings by the same respondent are correlated, because some respondents rate everything higher than others. Analyses must account for this, usually with random-intercept multilevel models or regression with clustered standard errors (Hox et al., 1991; Auspurg & Hinz, 2015).
The basic model regresses the rating on the vignette dimensions. Because the dimensions were randomised, their coefficients estimate the causal effect of each dimension on judgements. Respondent characteristics can be added to the model, and interactions between respondent and vignette characteristics show whether different groups weigh dimensions differently.
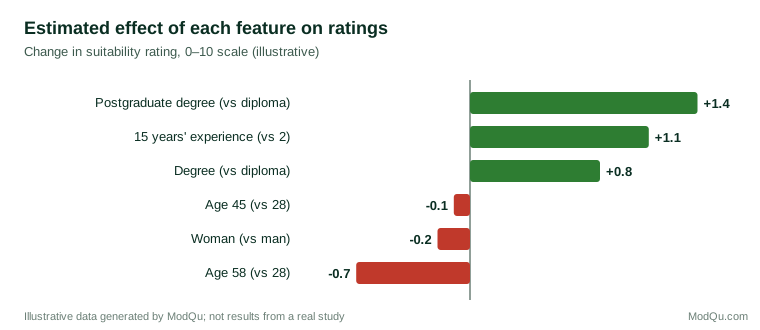
A useful feature of factorial surveys is that the relative importance of dimensions can be compared directly. If a postgraduate degree raises ratings by 1.4 points and an age of 58 lowers them by 0.7 points, the results show how much of one characteristic respondents would trade for another in their judgements (illustrative figures).
A worked example
Consider a study of how the public judges the fairness of a company's decision to raise prices. The researchers choose five dimensions: the size of the increase (2, 5 or 10 per cent), the reason given (higher costs, higher demand or no reason), the company's recent profits (losses, stable or record profits), how much notice customers receive (none, one month or three months) and whether the company offers a discount to existing customers (yes or no). The vignette universe contains 3 × 3 × 3 × 3 × 2 = 162 vignettes, so the researchers use a fractional design to select 54, divided into six decks of nine. Each respondent in an online survey of 3,000 adults is assigned a deck at random and rates each vignette for fairness from 0 to 10.
A multilevel regression of the fairness ratings on the five dimensions might show that the reason given matters most, with increases blamed on higher demand judged far less fair than those blamed on higher costs, followed by the company's profits and the size of the increase, while notice and discounts matter less (illustrative findings). Interactions with respondent characteristics might show that respondents on lower incomes weigh the size of the increase more heavily. Such results would tell a company not just whether customers object to price increases but which features of an increase drive their reactions, and they would be difficult to obtain from direct questions such as "Is it fair for companies to raise prices when demand rises?"
Common problems and how to avoid them
Several problems recur in vignette studies, and most can be prevented at the design stage.
- Too much text. Long vignettes with many dimensions overload respondents, who then focus on a few salient features. Keeping vignettes short, with dimensions presented in a consistent and easy-to-scan format, helps respondents process all the information.
- Too many vignettes. Fatigue reduces the consistency of ratings. If many vignettes are needed, the sample can be enlarged and the number per respondent reduced.
- Unrealistic levels. Levels outside the range respondents find plausible, such as extreme salaries, may produce ratings that reflect surprise rather than judgement.
- Dimensions that signal the purpose. If a single sensitive dimension stands out, respondents may guess what is being studied. Including several dimensions of similar prominence reduces this risk.
- Ignoring the data structure. Treating all ratings as independent overstates precision. Multilevel models or clustered standard errors are necessary (Hox et al., 1991).
Reporting a vignette study
Readers need enough information to judge the quality of a vignette study and to replicate it. A good report includes the full text of at least one vignette, a list of dimensions and levels, how vignettes were selected and allocated to respondents, the number of vignettes each respondent rated, the response scale, the sample and the analysis model. Reporting the full set of estimated effects, not only those that were significant, allows readers to see the relative importance of all the dimensions. Guidance on experimental vignette methodology stresses this kind of transparency as a condition for credible results (Aguinis & Bradley, 2014).
Validity: do vignette judgements match real behaviour?
The most important question about vignette experiments is whether hypothetical judgements reflect real decisions. Respondents rating vignettes know that their choices have no consequences, and they may respond differently than they would in reality.
Evidence on this question is encouraging but mixed. One study compared vignette and conjoint experiments with a real-world benchmark: votes on applications for citizenship in Swiss municipalities, where the characteristics of applicants and the outcomes were recorded. The paired conjoint design came closest to reproducing the real effects of applicants' characteristics, while vignette designs performed somewhat less well (Hainmueller et al., 2015). Studies of hiring that send real applications to employers, varying the names or characteristics of applicants, offer another benchmark. Such field experiments have found discrimination that respondents might not admit in surveys (Bertrand & Mullainathan, 2004), and vignette studies can be compared with them.
Generalising from vignette results also depends on the sample. Studies replicating survey experiments across different samples have found similar effects in many cases, but not all (Mullinix et al., 2015). The distinction between internal validity, which randomisation provides, and external validity, which depends on the realism of the task and the representativeness of the sample, is central to interpreting vignette experiments (Shadish et al., 2002).
Applications
Vignette experiments have been used across the social sciences and beyond. A review of factorial surveys in sociology found applications to justice and fairness, social status, deviance and crime, health care decisions and family obligations (Wallander, 2009). Examples include:
- Justice and fairness: what earnings are considered fair for different workers (Jasso & Webster, 1997).
- Discrimination: how characteristics such as sex, age or ethnicity affect judgements of job applicants or tenants.
- Health care: how doctors' treatment decisions vary with patients' characteristics.
- Public policy: which features of a policy or candidate drive public support (Hainmueller et al., 2014).
- Organisational research: how managers evaluate employees, ethical dilemmas or business decisions (Aguinis & Bradley, 2014).
In business and market research
Market research has used conjoint analysis for decades to understand how customers trade off product features and price (Green & Srinivasan, 1990). Vignette experiments offer similar insight for decisions that are not purchases. A company might use them to learn how customers judge the fairness of different refund policies, how employees evaluate different working arrangements or how the public reacts to different descriptions of a service change. Because the method estimates the weight of each feature, it gives decision-makers practical guidance: which changes would matter most to the people affected.
Business researchers should apply the same design principles as academic studies: choose dimensions carefully, avoid implausible combinations, limit the number of vignettes per respondent and use analysis that accounts for repeated ratings. They should also be cautious about treating stated judgements as forecasts of actual behaviour, and combine vignette results with behavioural data where possible.
Limitations
Vignette experiments have several limitations. They measure judgements about hypothetical cases, which may differ from real decisions. The selection of dimensions and levels shapes the results, and important factors left out of the design cannot be detected. Rating many vignettes is demanding, and respondents may adopt shortcuts, such as focusing on one or two dimensions. Finally, vignettes describe situations in words, which may not convey the information that people use in real situations, such as appearance or tone of voice (Atzmüller & Steiner, 2010; Groves et al., 2009).
Conclusion
Vignette experiments allow surveys to study judgements in context. By varying the features of realistic descriptions at random, they measure how much each feature matters to respondents, reduce some forms of social desirability and combine the strengths of experiments and surveys. Factorial surveys, conjoint analysis and simpler vignette designs have been used to study fairness, discrimination, preferences and decisions in many fields. Their value depends on careful design, analysis that respects the structure of the data and interpretation that keeps the difference between hypothetical judgements and real behaviour in view.
References
Aguinis, H., & Bradley, K. J. (2014). Best practice recommendations for designing and implementing experimental vignette methodology studies. Organizational Research Methods, 17(4), 351–371. https://doi.org/10.1177/1094428114547952
Alexander, C. S., & Becker, H. J. (1978). The use of vignettes in survey research. Public Opinion Quarterly, 42(1), 93–104. https://doi.org/10.1086/268432
Atzmüller, C., & Steiner, P. M. (2010). Experimental vignette studies in survey research. Methodology, 6(3), 128–138. https://doi.org/10.1027/1614-2241/a000014
Auspurg, K., & Hinz, T. (2015). Factorial survey experiments. SAGE. https://doi.org/10.4135/9781483398075
Auspurg, K., & Jäckle, A. (2017). First equals most important? Order effects in vignette-based measurement. Sociological Methods & Research, 46(3), 490–539. https://doi.org/10.1177/0049124115591016
Auspurg, K., Hinz, T., Liebig, S., & Sauer, C. (2015). The factorial survey as a method for measuring sensitive issues. In U. Engel, B. Jann, P. Lynn, A. Scherpenzeel, & P. Sturgis (Eds.), Improving survey methods: Lessons from recent research (pp. 137–149). Routledge.
Bertrand, M., & Mullainathan, S. (2004). Are Emily and Greg more employable than Lakisha and Jamal? A field experiment on labor market discrimination. American Economic Review, 94(4), 991–1013. https://doi.org/10.1257/0002828042002561
Dülmer, H. (2007). Experimental plans in factorial surveys: Random or quota design? Sociological Methods & Research, 35(3), 382–409. https://doi.org/10.1177/0049124106292367
Finch, J. (1987). The vignette technique in survey research. Sociology, 21(1), 105–114. https://doi.org/10.1177/0038038587021001008
Green, P. E., & Srinivasan, V. (1990). Conjoint analysis in marketing: New developments with implications for research and practice. Journal of Marketing, 54(4), 3–19. https://doi.org/10.1177/002224299005400402
Groves, R. M., Fowler, F. J., Jr., Couper, M. P., Lepkowski, J. M., Singer, E., & Tourangeau, R. (2009). Survey methodology (2nd ed.). Wiley.
Hainmueller, J., Hangartner, D., & Yamamoto, T. (2015). Validating vignette and conjoint survey experiments against real-world behavior. Proceedings of the National Academy of Sciences, 112(8), 2395–2400. https://doi.org/10.1073/pnas.1416587112
Hainmueller, J., Hopkins, D. J., & Yamamoto, T. (2014). Causal inference in conjoint analysis: Understanding multidimensional choices via stated preference experiments. Political Analysis, 22(1), 1–30. https://doi.org/10.1093/pan/mpt024
Hox, J. J., Kreft, I. G. G., & Hermkens, P. L. J. (1991). The analysis of factorial surveys. Sociological Methods & Research, 19(4), 493–510. https://doi.org/10.1177/0049124191019004003
Jasso, G., & Webster, M., Jr. (1997). Double standards in just earnings for male and female workers. Social Psychology Quarterly, 60(1), 66–78. https://doi.org/10.2307/2787012
Jasso, G. (2006). Factorial survey methods for studying beliefs and judgments. Sociological Methods & Research, 34(3), 334–423. https://doi.org/10.1177/0049124105283121
Louviere, J. J., Hensher, D. A., Swait, J. D., & Adamowicz, W. (2000). Stated choice methods: Analysis and applications. Cambridge University Press. https://doi.org/10.1017/CBO9780511753831
Mullinix, K. J., Leeper, T. J., Druckman, J. N., & Freese, J. (2015). The generalizability of survey experiments. Journal of Experimental Political Science, 2(2), 109–138. https://doi.org/10.1017/XPS.2015.19
Mutz, D. C. (2011). Population-based survey experiments. Princeton University Press.
Rossi, P. H., & Anderson, A. B. (1982). The factorial survey approach: An introduction. In P. H. Rossi & S. L. Nock (Eds.), Measuring social judgments: The factorial survey approach (pp. 15–67). SAGE.
Sauer, C., Auspurg, K., Hinz, T., & Liebig, S. (2011). The application of factorial surveys in general population samples: The effects of respondent age and education on response times and response consistency. Survey Research Methods, 5(3), 89–102. https://doi.org/10.18148/srm/2011.v5i3.4625
Shadish, W. R., Cook, T. D., & Campbell, D. T. (2002). Experimental and quasi-experimental designs for generalized causal inference. Houghton Mifflin.
Sniderman, P. M., & Grob, D. B. (1996). Innovations in experimental design in attitude surveys. Annual Review of Sociology, 22, 377–399. https://doi.org/10.1146/annurev.soc.22.1.377
Wallander, L. (2009). 25 years of factorial surveys in sociology: A review. Social Science Research, 38(3), 505–520. https://doi.org/10.1016/j.ssresearch.2009.03.004