
Surveys · Foundations and history
Cross-Sectional and Longitudinal Survey Designs: Choosing the Right Frame
A survey can take a single snapshot, repeat the snapshot over time, or follow the same people for years. This article explains each design, what it can and cannot reveal about change, and how to choose between them.
Many of the most important questions in social and business research are about change. Is customer satisfaction rising or falling? Do employees who receive training become more engaged? Which households move into or out of poverty, and why? A survey's ability to answer such questions depends on its time dimension: whether it measures people once, measures different people at several points in time, or measures the same people repeatedly.
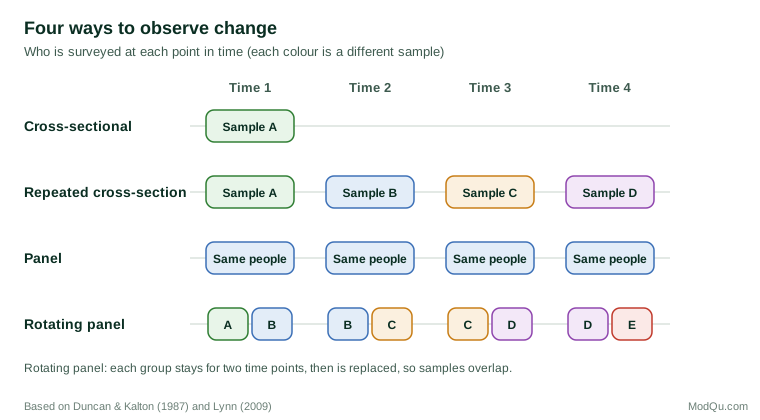
The basic choice is between cross-sectional designs, which observe a sample at one point in time, and longitudinal designs, which observe over time. Within the longitudinal family there are important variants: repeated cross-sections, panels, rotating panels and cohort studies. Each has distinct strengths and weaknesses, and the right choice depends on the kind of change the research needs to understand (Duncan & Kalton, 1987).
The cross-sectional survey
A cross-sectional survey collects data from a sample once. It is the most common design because it is the simplest and cheapest. It can describe a population at a moment, compare groups within it and examine how characteristics are associated with one another (de Vaus, 2013).
Its limitations concern time. A single cross-section cannot show how things are changing, except through retrospective questions about the past, which depend on memory. It also cannot establish the order in which things happened. If a cross-sectional survey finds that customers who use a mobile app are more satisfied, it cannot tell whether using the app increases satisfaction or whether satisfied customers are more likely to download the app. Comparisons between age groups are another trap: differences between younger and older people at one point in time may reflect ageing, or may reflect the different eras in which the groups grew up, and a single cross-section cannot separate the two (Menard, 2002).
Retrospective questions
A cross-sectional survey can collect some information about the past by asking people to recall it: when they last changed jobs, how often they bought a product last year, what they thought about an issue five years ago. Such questions are cheap, but memory is fallible. People forget events, misplace them in time and reinterpret past attitudes in the light of present ones. A well-documented error is telescoping, in which respondents report events as more recent than they really were, pulling them into the period being asked about. Neter and Waksberg (1964) showed in a study of household expenditure that this inflated reports of spending substantially, and that "bounded" interviews, in which the previous interview marks the start of the recall period, reduced the problem. Bounding is only possible when the same people are interviewed more than once, which is one of the less obvious advantages of panel designs.
Repeated cross-sectional surveys
A repeated cross-sectional survey, sometimes called a trend study, asks the same questions of a fresh sample of the same population at intervals. Many of the best-known social indicators come from such surveys. The General Social Survey in the United States, for example, has asked a core set of questions of new national samples since 1972, allowing researchers to trace long-term shifts in attitudes.
Repeated cross-sections are excellent for measuring net change in a population: whether the overall share of people holding a view or having a characteristic has gone up or down. Because each sample is drawn afresh, each represents the population as it is at the time, including newcomers, and there is no problem of people dropping out over time (Firebaugh, 1997). They are also straightforward to analyse and to explain.
What they cannot measure is gross change: how many individuals changed and in which direction. If 40% of customers are satisfied in both January and July, the stability of the total may hide a large amount of movement, with many customers becoming satisfied and an equal number becoming dissatisfied. Only by observing the same people twice can this turnover be seen.
Panel surveys
A panel survey follows the same sample of people over time, interviewing them at regular intervals called waves. The approach goes back at least to Lazarsfeld et al. (1944), who interviewed the same voters several times during the 1940 United States presidential campaign to see how and when they made up their minds. Large household panels such as the Panel Study of Income Dynamics, which has followed American families since 1968, have since become central resources for research on income, employment, health and family life (Lynn, 2009).
Panels offer several unique advantages (Duncan & Kalton, 1987; Lynn, 2009):
- Gross change and transitions. Panels show how many people move into and out of states such as unemployment, poverty, satisfaction or customer status, how long they stay and what happens before and after a change.
- Order of events. Because measurements are repeated, researchers can see whether a change in one characteristic came before or after a change in another, which strengthens causal reasoning.
- Control for stable characteristics. Each person can be compared with their own earlier self. Statistical methods such as fixed-effects models use this within-person variation to remove the influence of stable characteristics that were never measured, such as personality or family background (Allison, 2009; Halaby, 2004).
- Precision for measuring change. Because the same people are measured twice, much of the person-to-person variation cancels out when change is calculated, so a panel can estimate the size of a change more precisely than two independent samples of the same size (Kish, 1987).
These benefits come at a cost. Panels are expensive to maintain: people move, change contact details and lose interest, so tracing and keeping members requires sustained effort. Three methodological problems are especially important.
Attrition
Panel members drop out over time, and the people who leave are often different from those who stay. In the Panel Study of Income Dynamics, for example, roughly half of the original sample had been lost by the late 1980s, although Fitzgerald et al. (1998) found that the remaining sample stayed broadly representative on many economic characteristics once weights were applied. Other studies show that attrition is not a single process: some members leave early, some fade gradually and some miss waves before returning (Lugtig, 2014). Panels manage attrition through tracing, incentives, flexible modes and weighting, and must regularly add new members to keep representing a changing population.
Panel conditioning
Taking part in a survey can change the people taking part. Respondents may become more aware of a topic, change their behaviour because they have been asked about it, or learn how to answer in ways that shorten the interview, for example by saying "no" to screening questions that lead to follow-up questions. Warren and Halpern-Manners (2012) reviewed the evidence and concluded that conditioning effects are real for some topics and questions, though often small. Das et al. (2011) developed tests for distinguishing conditioning from attrition effects, since both can make a long-standing panel differ from a fresh sample.
Initial representativeness
A panel represents the population from which it was drawn at the time it began. Immigrants, young people who reach adulthood and new businesses that did not exist when the panel was selected are not automatically included. Long-running panels address this by adding refreshment samples and by following new household members, such as children who form their own households.
Rotating panels
A rotating panel combines features of panels and repeated cross-sections. Each sampled household or business remains in the survey for a fixed number of waves and is then replaced. At any time the sample includes groups that joined at different points. Many national labour force surveys use this design. Canada's Labour Force Survey keeps each sampled dwelling for six consecutive months, and the United States Current Population Survey interviews households for four months, drops them for eight and then interviews them for another four. Overlapping samples make month-to-month estimates of change more precise, while the regular rotation limits attrition and conditioning and keeps the sample fresh.
Rotation brings its own subtle bias. Bailar (1975) showed that estimates differ systematically depending on how many times a rotation group has been interviewed, a phenomenon known as rotation group bias. Unemployment, for instance, tended to be reported at higher levels in a group's first interview than in later ones.
Cohort studies
A cohort study follows a group of people who share a defining experience, usually being born in the same period. Britain's national birth cohort studies are well-known examples: the National Child Development Study has followed people born in one week of 1958, and the 1970 British Cohort Study follows those born in one week of 1970 (Power & Elliott, 2006; Elliott & Shepherd, 2006). Comparing cohorts born at different times allows researchers to separate the effects of age from the effects of growing up in a particular era, a distinction that a single cross-section cannot make.
The underlying idea is older than the studies themselves. Ryder (1965) argued that social change happens largely through the succession of cohorts: each generation encounters history at a different age, carries the imprint of its formative years forward, and gradually replaces the generation before it. Cohort analysis tries to separate three overlapping influences: age effects (changes that come with getting older), period effects (events that affect everyone at a given time, such as a recession) and cohort effects (lasting differences between generations). The three are mathematically entangled, because a person's birth year, age and the calendar year are linked, and no statistical technique can separate them without some assumptions (Glenn, 2005). Repeated cross-sections that span many years, together with true cohort panels, give the best chance of telling them apart.
Analysing longitudinal data
The richness of longitudinal data brings analytical complexity. Observations from the same person are correlated, and standard methods that assume independent observations understate uncertainty. Specialised methods such as fixed-effects and random-effects regression, growth curve models and event history analysis are designed for these data (Halaby, 2004; Allison, 2009). Cross-lagged panel models, which examine whether one variable predicts later changes in another, are widely used but have been criticised for confusing stable differences between people with change within people (Hamaker et al., 2015).
The time between waves also matters. If waves are too far apart, short-lived changes are missed and respondents struggle to remember events between interviews. If they are too close together, respondent burden and conditioning rise and real change may be too small to detect.
Longitudinal designs in business research
The same choices arise in commercial research. A brand tracking study that interviews a new sample every month is a repeated cross-section; it shows how awareness and preference are moving in the market but not which consumers switched. A customer panel that surveys the same members every quarter is a panel; it can show how individual satisfaction changes after a service failure or a price rise, and which earlier answers predict later cancellation. Employee surveys often fall between the two, since many of the same staff answer each year while others join and leave. Treating such data as a panel requires matching responses over time, which raises questions of confidentiality that must be resolved before data collection begins.
Kasprzyk et al. (1989) note that many of the methodological lessons of large public panels, from tracing respondents to weighting for attrition, apply equally to smaller commercial panels, which are often run with less attention to these issues.
Choosing a design
The choice of time dimension follows from the research question.
- To describe a population at one point in time, or to compare groups within it, a cross-sectional survey is usually enough.
- To track how a population is changing overall, such as market share, satisfaction levels or public opinion, a repeated cross-section is often the best value. It represents the population at each point and avoids attrition and conditioning.
- To understand individual change, including who changes, how fast and after what events, a panel is needed. The same applies when the aim is to strengthen causal conclusions by controlling for stable individual differences.
- To produce precise estimates of short-term change for official statistics, a rotating panel is a strong compromise.
- To study how the experiences of different generations unfold, cohort studies are uniquely valuable.
Practical constraints matter as well. Panels require long-term funding, careful data management and the ability to recontact people, which brings additional consent and privacy obligations. Repeated cross-sections are simpler but must keep their methods stable over time if trends are to be trusted, since a change in sampling, mode or wording can produce an apparent trend that is purely methodological (Groves et al., 2009).
Conclusion
Time is one of the most powerful dimensions in survey design, and also one of the most often ignored. A single snapshot can describe a population but cannot reveal how it is changing or what comes first. Repeated cross-sections measure trends in the population as a whole; panels reveal the individual movements underneath those trends; rotating panels and cohort studies offer specialised compromises. Choosing the right frame at the start determines which questions the data will ever be able to answer, so it deserves as much thought as the questionnaire itself.
References
Allison, P. D. (2009). Fixed effects regression models. SAGE. https://doi.org/10.4135/9781412993869
Bailar, B. A. (1975). The effects of rotation group bias on estimates from panel surveys. Journal of the American Statistical Association, 70(349), 23–30. https://doi.org/10.1080/01621459.1975.10480255
Das, M., Toepoel, V., & van Soest, A. (2011). Nonparametric tests of panel conditioning and attrition bias in panel surveys. Sociological Methods & Research, 40(1), 32–56. https://doi.org/10.1177/0049124110390765
de Vaus, D. (2013). Surveys in social research (6th ed.). Routledge. https://doi.org/10.4324/9780203519196
Duncan, G. J., & Kalton, G. (1987). Issues of design and analysis of surveys across time. International Statistical Review, 55(1), 97–117. https://doi.org/10.2307/1403273
Elliott, J., & Shepherd, P. (2006). Cohort profile: 1970 British Birth Cohort (BCS70). International Journal of Epidemiology, 35(4), 836–843. https://doi.org/10.1093/ije/dyl174
Firebaugh, G. (1997). Analyzing repeated surveys. SAGE. https://doi.org/10.4135/9781412983396
Fitzgerald, J., Gottschalk, P., & Moffitt, R. (1998). An analysis of sample attrition in panel data: The Michigan Panel Study of Income Dynamics. The Journal of Human Resources, 33(2), 251–299. https://doi.org/10.2307/146433
Glenn, N. D. (2005). Cohort analysis (2nd ed.). SAGE. https://doi.org/10.4135/9781412983662
Groves, R. M., Fowler, F. J., Jr., Couper, M. P., Lepkowski, J. M., Singer, E., & Tourangeau, R. (2009). Survey methodology (2nd ed.). Wiley.
Halaby, C. N. (2004). Panel models in sociological research: Theory into practice. Annual Review of Sociology, 30, 507–544. https://doi.org/10.1146/annurev.soc.30.012703.110629
Hamaker, E. L., Kuiper, R. M., & Grasman, R. P. P. P. (2015). A critique of the cross-lagged panel model. Psychological Methods, 20(1), 102–116. https://doi.org/10.1037/a0038889
Kasprzyk, D., Duncan, G. J., Kalton, G., & Singh, M. P. (Eds.). (1989). Panel surveys. Wiley.
Kish, L. (1987). Statistical design for research. Wiley. https://doi.org/10.1002/0471725196
Lazarsfeld, P. F., Berelson, B., & Gaudet, H. (1944). The people's choice: How the voter makes up his mind in a presidential campaign. Duell, Sloan and Pearce.
Lugtig, P. (2014). Panel attrition: Separating stayers, fast attriters, gradual attriters, and lurkers. Sociological Methods & Research, 43(4), 699–723. https://doi.org/10.1177/0049124113520305
Lynn, P. (Ed.). (2009). Methodology of longitudinal surveys. Wiley. https://doi.org/10.1002/9780470743874
Menard, S. (2002). Longitudinal research (2nd ed.). SAGE. https://doi.org/10.4135/9781412984867
Neter, J., & Waksberg, J. (1964). A study of response errors in expenditures data from household interviews. Journal of the American Statistical Association, 59(305), 18–55. https://doi.org/10.1080/01621459.1964.10480699
Power, C., & Elliott, J. (2006). Cohort profile: 1958 British birth cohort (National Child Development Study). International Journal of Epidemiology, 35(1), 34–41. https://doi.org/10.1093/ije/dyi183
Ryder, N. B. (1965). The cohort as a concept in the study of social change. American Sociological Review, 30(6), 843–861. https://doi.org/10.2307/2090964
Warren, J. R., & Halpern-Manners, A. (2012). Panel conditioning in longitudinal social science surveys. Sociological Methods & Research, 41(4), 491–534. https://doi.org/10.1177/0049124112460374